One way to determine an analyte’s concentration or perform a biophysical analysis is to evaluate the variation in the RI. Many biomolecules have refractive indices between 1.300 and 1.600, while the refractive index of most gases ranges from 1.000 to 1.600, such as NOx37, SOx, and Cox38. In addition, since the number of blood illnesses and other forms of cancer continues to rise, there is a pressing need to detect origins and target tissues. For instance, some research has been conducted on the hemoglobin value of blood39 and the ability to see certain types of cancer, such as liver, blood, and breast, using an optical method. In this paper, we calculate the influence of the RI change of an analyte when it changes between 1 and 1.6, while the RI of the medium is assumed to be n = 1.33.
First, we examine the effect of graphene layer number on proposed biosensor S. Figure 4 demonstrates the absorption spectra of the structure with 1,2,3,4 and 5 graphene layers. To analyze the proposed biosensor S, the RI of the analyte has been changed from 1.3 to 1.301, which gives Δn = 0.001 a minimal value representing the accuracy of the proposed structure. In addition, the electric field distributions on the graphene surface have been demonstrated for each case in the inset of Fig. 4a–g. As one can see, the FP pattern can be easily seen from the electric field pattern on the graphene surface and its nodes and antinodes induced by plasmonic wave interference. Each node and antinode crated in electric field distribution on graphene’s surface represents a particular resonance order.
(a) structure with only one graphene layer (b, c) first and second mode of design with two graphene layers (d, e) first and second mode of structure with three graphene layers (f, g) first and second mode of system with four graphene layers.
In addition, the S of each case is written in the inset of Fig. 4. For example, the structure of the proposed biosensor with a graphene layer is shown in Fig. 4a. As can be seen, in this case, only one mode exists in the structure absorption profile induced by the FP interferometer and has an S of 3450 nm/RIU. Figure 4b and c show the first and second modes of the proposed biosensor with two layers of graphene, which have an S of 1000 nm/RIU and 3500 nm/RIU, respectively. Figure 4d and e show the response of the structure to the change of the analyte RI as much as 0.0001 for mode 1 and mode 2, respectively, when three layers of graphene are used, as can be seen, mode 1 has a S of 900 nm/RIU and mode 2 has an S of 4000 nm/RIU. Finally, Fig. 4f and g show the optical absorption of the proposed biosensor structure with four layers of graphene/CaF2 sandwich structure, which has an S of 1500 nm/RIU for mode 1 and 500 nm/RIU for mode 2, respectively.
As shown in Fig. 4a, when the structure consists of one layer of graphene, there is only one resonance in 7 µm to 14 µm, but by adding more graphene layers, there are two resonance modes in this range.
Figure 5 represents the absorption spectra of the proposed biosensor when there is five graphene/Caf2 sandwich structure. As shown in Fig. 5a, there are two resonances between 8 µm and 12 µm. By comparing the first resonance, which occurred in 9.4 and its relative electric field distributions, with the second resonance wavelength, which happened at 10.9 µm, it is found that by decreasing the resonance wavelength, the number of FP resonance order which can be defined as the number of nodes and antinodes that appeared in the electric field distribution is increased from k = 6 to k = 12 for resonance wavelength of 9.4 and 10.9 µm, respectively. It is the most well-known behavior of the FP-based structures. Figure 5b,c demonstrates the S of the proposed biosensor structure with five graphene layers.
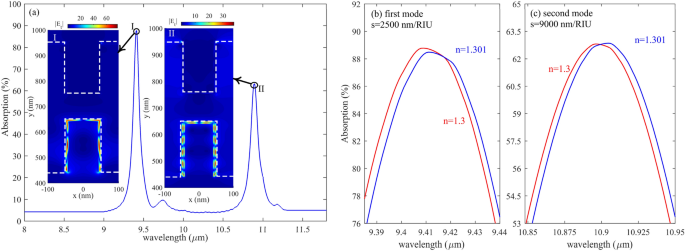
(a) Absorption of structure with five graphene layers in the range of 8–12 µm (b, c) first and the second mode of absorption of the proposed structure with five graphene layers with Δn = 0.001 in the medium index, respectively. The red line represents n = 1.3, and the blue line represents a medium with n = 1.301.
Comparing Figs. 5 with 4 shows that with five graphene layers, the S is as prominent as 9000 nm/RIU, much more than three, two, and one graphene/Caf2 layers. Therefore, we continue our simulation and calculations for a proposed biosensor with five graphene layers after this.
We simulated wavelength-dependent absorption for various graphene Fermi levels, as shown in Fig. 6, to demonstrate the adjustable sensing capabilities of graphene plasmonic gratings. The resonant modes illustrate striking blue wavelength variations, which are 9.8 µm to 9 µm for the first mode and 11.14 µm to 10.4 for the second mode when the graphene Fermi level (i.e., chemical potential) varies from 1 to 1.2 eV. Therefore, broadly dynamic tuning operations may be accomplished by electrostatically regulating the Fermi level of graphene. As it is evident from the figure, by increasing the applied gate voltage to the proposed biosensor, the resonance frequency shifts to high frequencies, which can be translated to resonance wavelength shifts to low wavelength, and it can make the proposed structure tunable to the resonance wavelength for both mode and add flexibility to the proposed system. And it adds another advantage to the proposed biosensor.
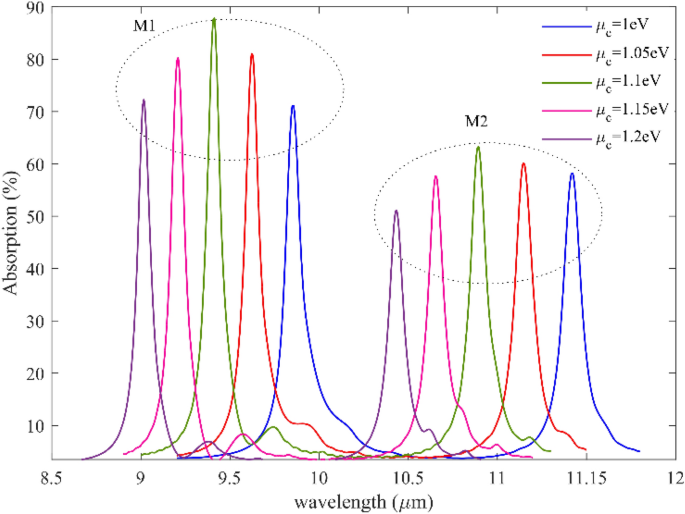
Absorption spectra for two resonance modes and five different fermi levels from 1 to 1.2 with the steps of 0.05 eV, As it is evident from the figure, by increasing the graphene Fermi level, the resonance frequency shifts to high frequencies, which can be translated to resonance wavelength shifts to low wavelength.
Figure 7a–l represents the shift of resonance wavelengths when the analyte RI changes only 0.001. System’s S, FOM and Q are also calculated when RI varies between 1 and 1.6. This range has been studied by considering the large variety of gas alloys and biomolecules’ refractive indices in these around. The outcomes have shown that the suggested structure’s FOM changes with sample RI. For instance, the minimum FOM belongs to n = 1.6 with a value of 13.15, and the maximum FOM belongs to n = 1.3 with a value of 81.81. however, its value reaches 68 when the sample RI is 1. CO2 is the most crucial gas (n = 1.0002) detected using the proposed sensor. Moreover, some biomolecules, such as MCF-7 (n = 1.401) and MDA-MB-231 (n = 1.399), can be used to diagnose breast cancer, and Jurkat biomolecule (n = 1.390), which is used to detect leukemia, respectively, are in this system identification region40 and can be easily detected by the proposed sensor.
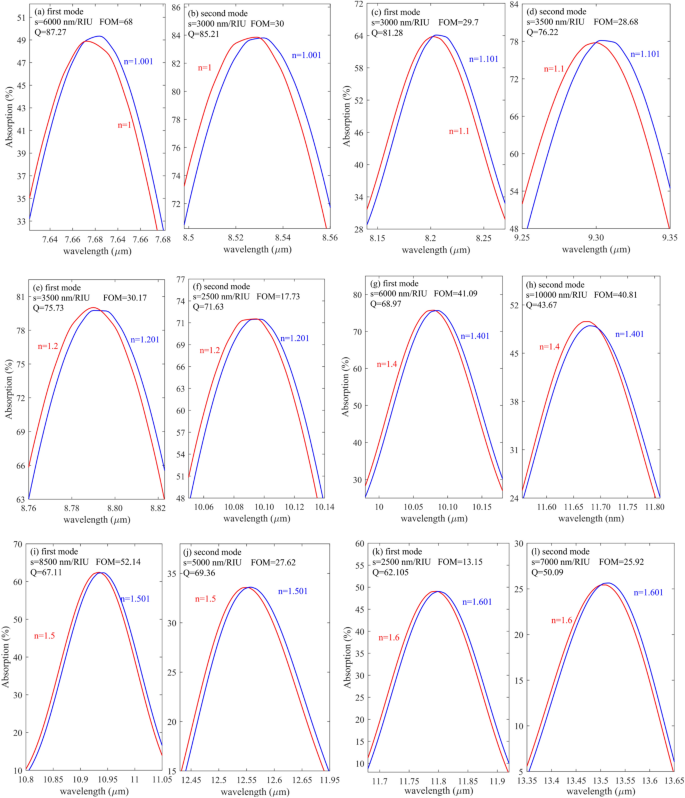
(a, c, e, g, i, k) first mode S and FOM and (b, d, f, h, j, l) second mode S and FOM for n = 1, n = 1.1, n = 1.2, n = 1.4, n = 1.5 and n = 1.6 respectively.
As evident from Fig. 7a and b, when the analyte RI changes from 1 to 1.001, the S, FOM, and Q are 6000 nm/RIU 68 and 87.27, respectively, for the first mode. For the second mode shown in Fig. 7b, these values are 3000 nm/RIU, 30, and 85.2, respectively. Moreover, Fig. 7c and d represent the absorption response when the analyte RI varies from 1.1 to 1.101. as it is written in the inset of the figures, the S, FOM, and Q for the first mode are 3000 nm/RIU, 30 and 81.28 respectively in addition as shown in the in Fig. 7 (d) values for the second mode are 3500 nm/RIU, 29, and 76.
Figure 7e and f represent the absorption profile when the analyte RI varies from 1.2 to 1.201. As can be seen, the first and second modes, the S, FOM, and Q, are 3500 nm/RIU, 2500 nm/RIU, and 30, 18, 76, 72, respectively. Figure 7g and h represent the S, FOM, and Q when the RI of the sample changes from 1.4 to 1.401. for the first mode shown in Fig. 7g, the S, FOM, and Q are 6000 nm/RIU, 41, and 69, and for the second mode, 10,000 nm/RIU, 40.8, and 43.67, respectively. Figure 7i and j show the proposed sensor’s response when the analyte’s RI changes from 1.5 to 1.501 for the first and second modes, respectively. The S FOM and Q are written in the inset of the figures.
Finally, Fig. 7k and l demonstrate the absorption spectra of proposed biosensors for the first and second modes, respectively, when the analyte RI varies from 1.6 to 1.601. the S, FOM, and Q for the first mode were obtained as 2500 nm/RIU, 13.15, and 62.1, respectively, and for the second mode were gained as 7000 nm/RIU, 26, and 50, respectively.
Additionally, the RI discrepancies between liver cancer cells (HCC = 1.347) and normal liver cells (NHCC = 1.345) are from the rank of 0.002, which can be identified using the suggested biosensor41. These results have been compared to other SPR-based sense methods, such as fiber optics, which can sense RI with an accuracy of Δn = 0.01 42, gold grating on SiO2, which is capable of detecting samples with an accuracy of Δn = 0.005 per RI unit43. In contrast, the proposed structure can sense refractive indices with a precision of less than 0.001.
Different glucose concentrations found in urine samples range in refractive index from 1.332 to 1.34044. The refractive index of a patient with diabetes mellitus is relatively high. The mean refractive index of morning urine samples ranges from 1.336 ± 0.0019. In contrast, the refractive index of specific random samples is 1.335 ± 0.0017. As clear from Fig. 8, The higher the glucose concentration (RI = 1.347), the absorption spectrum of the proposed structure shifts to larger wavelengths. Therefore, changing the urine concentration peak shifts according to the sensor’s absorption spectrum.
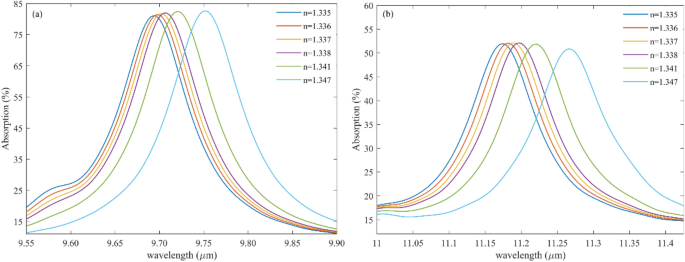
(a) M1 and (b) M2 for analyzing the refractive index (RI) of urine.
Figure 8 shows the capability of detecting urine concentration with precise accuracy. Figure 8a represents the absorption response of the first mode of the proposed structure for different glucose or urine concentrations whose RI changes from 1.335 to 1.347. likewise, Fig. 8b illustrates the absorption spectra of the proposed biosensor for the second mode when the urine concentration changes in the sample.
By looking precisely at Fig. 8, it can be understood that when the absorption profile peaks in large wavelengths, the sample has the highest value of glucose.
Table 2 indicates the key parameter of the proposed sensor, such as S, Q, and FOM for sensing glucose in the sample where the RI of urine varies from 1.335 to 1.347 for both modes. As can be seen, mode II shows high S compared with mode I. Likewise, the FOM and Q of the proposed structure for sensing glucose for mode II are large. Therefore, in this case, to have a tremendous improvement, choosing the second mode, which happens in large wavelengths, is suitable.
Diabetes mellitus is a chronic metabolic condition that affects millions of people worldwide. This article examines the response of a graphene grating-based sensor to the refractive index of urine samples (human renal fluids) to diagnose diabetes mellitus. Evanescent field interaction with the high glucose concentration, known as “hyperglycemia” (RI 1.347) sample over the proposed sensor, causes the refractive index to change. The proposed biosensor can also help detect low glucose levels (RI 1.2) and is named “hypoglycemia.”
Physically, a urine sample will change the surface tension, gravity, and refractive index due to the presence of glucose. Specific characteristics of label-free biosensing are their resistance to electromagnetic interference, compact design, the potential to integrate into the lab on a chip, etc. these sensors lead to significant developments in diagnosis, food safety management, pharmaceutical development, and monitoring of environmental hazards, and recently, it has become crucial to use a noninvasive glucose sensing method compared to the traditional blood pinpricking method. Also, some cancer such as Adrenal Gland Cancer, Blood Cancer, Breast Cancer I, Breast Cancer II, Cervical Cancer, and skin cancer have been investigated precisely.
Figure 9 demonstrates the S of the various cancerous cells shown in the Table 3 Concerning the incident wavelength. The graph mentioned earlier shows that type II breast cancer cells have greater S than other cancer cells. On the other hand, it is undoubtedly evident that the fluctuations of sensitivities concerning the incident source wavelength are negligible.
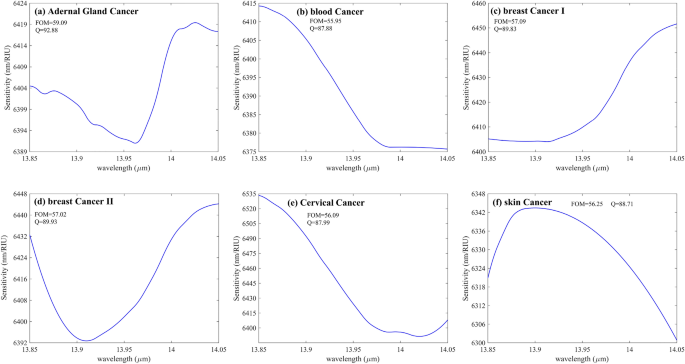
(a–f) S versus wavelength for six different cancer cells shown in Table 3. The maximum S belongs to (e), demonstrating the S of the proposed structure to Cervical Cancer. Other critical parameter variations of the designed sensor for these cancers are negligible, such as Q and FOM inscribed inside the figures.
Although the S fluctuation of the proposed structure concerning wavelength variations is insignificant for the diverse types of cancers shown in Table 3, it can be considered constant over the wavelength range shown in Fig. 9 (a)-(f). This independence of the S from the sources’ wavelength variations adds another merit to the proposed structure. But as evident in Fig. 9, the maximum S of the system for detecting PC-12 (Adrenal Gland Cancer) reaches about 6420 nm/RIU at the wavelength of 14.05 µm. In addition, the maximum S of Blood Cancer at the wavelength of approximately 13.85 µm goes 6415 nm/RIU. Also, the structure can identify (MDA)-(MB)231(Breast Cancer I) with a maximum S of around 6450 when the incident light wavelength has been fixed to 1.405 µm. For Breast Cancer type II, the thoroughgoing S, according to Fig. 9d, reaches about 6445 nm/RIU at 14.05 µm. Figure 9e represents the S concerning the incident wavelength of Cervical Cancer as it is evident from the figure that the amount of S has been sharply decreased from 6535 nm/RIU at a fixed wavelength of 13.85 µm to almost 6400 nm/RIU where the incident wavelength has been fixed to 14.05 µm. Also, the structure can sense Skin Cancer with a maximum S of nearly 6350 nm/RIU at 13.9 µm.
As evident from Fig. 9a–f, the following facts can be extracted from these figures. First of all, it is shown that the S variation concerning the wavelength variation is highly insignificant and negligible. The second circumstance is that the FOM and Q of all Cancers are almost constant. The maximum value of FOM and Q reaches 59 and 92, respectively, for Fig. 9a, which demonstrates Adrenal Gland Cancer, and the minimum value of FOM and Q decreased to almost 56 and nearly 87, respectively, belonging to Fig. 9b representing the S fluctuation of Blood Cancer when the incident wavelength range changes from 13.85 µm to 14.05 µm.
The lists of refractive indices for the various cancer cells employed in this study are shown in Table 3, taken from45,46,47,48,49,50,51. Moreover, (MDA)-(MB)-231 and MCF-7 are classified as Types I and II of breast cancer, respectively. The S of each cancer can be defined as the shift in the absorption of the proposed structure when the refractive index changes from cancer RI to its normal cell RI. For example, the Jurkat cell or blood cancer has a refractive index of 1.39 with an 80% concentration, while its normal cell refractive index is 1.37652,53. Also, the refractive index of Cervical cancer with an 80% concentration is 1.392, as shown in Table 3 and its normal cell refractive index is 1.368 with 30–70% concentration of the mentioned sample48,54,55,56,57,58. The refractive index of Adrenal Gland Cancer is 1.395 with an 80% concentration, and its normal cell owns a RI of 1.381 in the 30–70% concentration59. Also, Breast cancer I and type II own the normal cells with the RI of 1.385 and 1.38760. Finally, the RI of skin cancer (Basal Cell) with an 80% concentration is 1.38, and its normal cell (basal cell) RI with a concentration in the range of (30% to 70%) is 1.3659,60,61.
The capability of our proposed structure is not limited to these; the proposed sensor can identify and sense viruses inside the sample. The RI of different viruses is given in the previous literature62. For example, the RI of the human immunodeficiency virus (HIV) is 1.5, which is entirely covered by the proposed structure. Table 4 demonstrates the S as a function of virus type. As shown, five viruses have been examined with the proposed system. Since the size of some viruses is significant, therefore, to detect a virus, simply the proposed structure can be embedded inside a fluidic sample like blood and water. In the obtained results shown in Table 4 , the viruses are modeled as polystyrene particles with RI taken from63 inside a fluidic medium with its radius obtained from62.
The S of the proposed multilayer graphene sensor is compared in Table 5 with some of the previously published graphene-based sensors in reputable journals. This Table shows that our optimized multilayer graphene sensor has a highly competitive sensing performance which can open a new door for integrated optical applications. Since most plasmonic-based sensors structure has a metallic shape to induce LPR in a metal–dielectric interface, our proposed sensor, by taking advantage of the semi-metal feature of graphene, can efficiently generate the plasmonic waves on the graphene surface, which finally, due to propagating the plasmonic waves on graphene surface in the opposite direction, the FP interference has happened which is the base mechanism of the sensing in the suggested biosensors.






 Bitcoin
  Ethereum
  XRP
XRP  Tether
  Solana
  USDC
USDC  Lido Staked Ether
  Dogecoin
  TRON
TRON  Cardano
  Wrapped stETH
  Chainlink
  Hyperliquid
  Wrapped Bitcoin
  Ethena USDe
  Sui
Sui  Stellar
  Figure Heloc
  Avalanche
  Wrapped eETH
  Bitcoin Cash
  WETH
WETH  Hedera
  Litecoin
  LEO Token
  Cronos
  Toncoin
  USDS
USDS  Shiba Inu
  Binance Bridged USDT (BNB Smart Chain)
  Coinbase Wrapped BTC
  Polkadot
  WhiteBIT Coin
  Uniswap
  Ethena Staked USDe
  World Liberty Financial
  Ethena
  Mantle
  Monero
  Aave
Aave  Bitget Token
  Pepe
Pepe  Dai
Dai  OKB
OKB  Worldcoin
  Bittensor
  NEAR Protocol
  Jito Staked SOL