• Home
  • Cryptocurrency
    • Bitcoin
    • Ethereum
    • XRP
    • Litecoin
    • Altcoin
    • Cardano
    • Tether
    • DOGE
    • Solano
    • XLM
    • DOT
    • XDC
    • SHIBA
    • BNB
    • Ape
    • HBAR
    • QNT
  • Blockchain
  • Regulation
  • Market
  • Live
    • Prices
    • ICO
  • Meta
    • NFT
  • Technical Analysis
    • XRP
    • BTC
    • XLM
    • ADA
    • TETHER
    • ETC
    • ETH
    • DOGE
    • LTC
  • Exchange
  • Mining
Friday, September 12, 2025
  • Login
  • Register
Coin24h.com
  • Home
  • Cryptocurrency
    • Bitcoin
    • Ethereum
    • XRP
    • Litecoin
    • Altcoin
    • Cardano
    • Tether
    • DOGE
    • Solano
    • XLM
    • DOT
    • XDC
    • SHIBA
    • BNB
    • Ape
    • HBAR
    • QNT
  • Blockchain
  • Regulation
  • Market
  • Live
    • Prices
    • ICO
  • Meta
    • NFT
  • Technical Analysis
    • XRP
    • BTC
    • XLM
    • ADA
    • TETHER
    • ETC
    • ETH
    • DOGE
    • LTC
  • Exchange
  • Mining
No Result
View All Result
Coin24h.com
No Result
View All Result
Ledger Nano X - The secure hardware wallet
ADVERTISEMENT

Crypto Trading 101: The Moving Average Convergence Divergence

25 September 2021
in Blockchain
Reading Time: 4 mins read
A A
0
189
SHARES
1.5k
VIEWS
Share on FacebookShare on Twitter
cryptotrader
ADVERTISEMENT


Simple trading methods like the trend-following approach work best when trading cryptocurrencies or financial markets in general.

Related articles

Blockchain Powers Jack Ma’s -B Ant Group Energy Asset Strategy

Blockchain Powers Jack Ma’s $8-B Ant Group Energy Asset Strategy

9 September 2025
Japan Post Bank To Give Digital Yen Access To .3T Deposits

Japan Post Bank To Give Digital Yen Access To $1.3T Deposits

3 September 2025

While several technical indicators help identify changes in the strength, momentum, and duration of a trend, none are simpler and more widely used than the Moving Average Convergence Divergence (MACD).

[crypto-donation-box]

By definition, the MACD “turns two trend-following indicators, moving averages, into a momentum oscillator by subtracting the longer moving average from the shorter moving average.”

Since the MACD is a “trend following” or “lagging” indicator, it trails pricing events that have already happened in order to gauge the strength of the current trend.

Like with most indicators though, money is made by understanding how to use the indicator rather than how it works, but it’s worth explaining the inner workings of the MACD so you get an idea why it is such a beloved indicator.

Constructing the MACD

There are three main components to the MACD indicator: the MACD line (blue oscillator), the signal line (orange oscillator) and the histogram.

  1. MACD line is made up of the 12-period exponential moving average (EMA) minus the 26-period EMA.
  2. The signal line is the 9-period EMA of the MACD line.
  3. The histogram plots the difference between the MACD line and the signal line.

The explanation may be hard to wrap your head around, but the MACD is one of the easiest indicators to use because of how simply it’s data is visually represented.

The Cross

When the MACD crosses above the signal line, it is known as a bullish cross and when it crosses below, its known as a bearish cross. The crosses indicate a shift in trend momentum and represent buy or sell signals depending on the type of cross.

BTC/USD Daily Chart

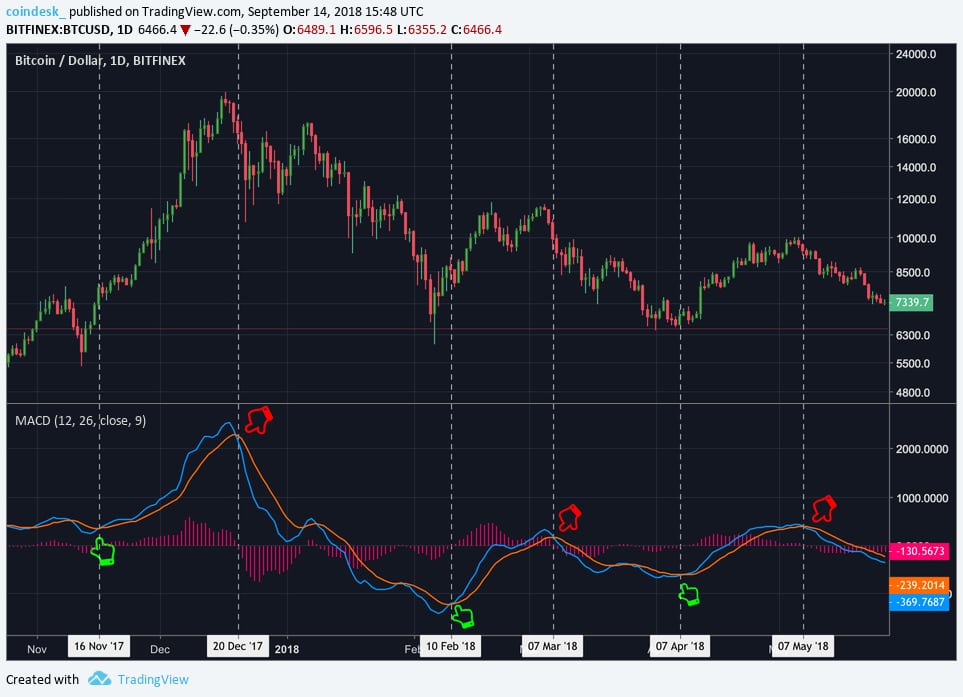
As can be seen, MACD crosses tend to provide confirmation of a trend change, at least in the short term.

Cryptohopper
ADVERTISEMENT

For example, on November 16, 2017, the MACD line made a bullish cross above the signal line, presenting a buy signal. The MACD stayed above the signal line for over a month when the rice went on to rally more than 150 percent before its next bearish cross. The bear cross occurred on Dec. 20, 2017, which signaled a bullish-to-bearish trend change.

It’s recommended to use the MACD in conjunction with other indicators like volume, RSI or price action because like any indicator the MACD is not 100 percent accurate and can give off false signals.

For example, the bullish crosses in January and March were relatively flat and failed to stay above the signal line for very long, resulting in short-lived price rallies and poor buy signals.

Overbought and Oversold

The MACD is great for identifying possible changes in a trend. But it can also identify overbought or oversold market conditions, as we’ll explore below.

The conditions are presented when the MACD and signal line separate too far away from both one another as well as the zero line.

BTC/USD Weekly Chart

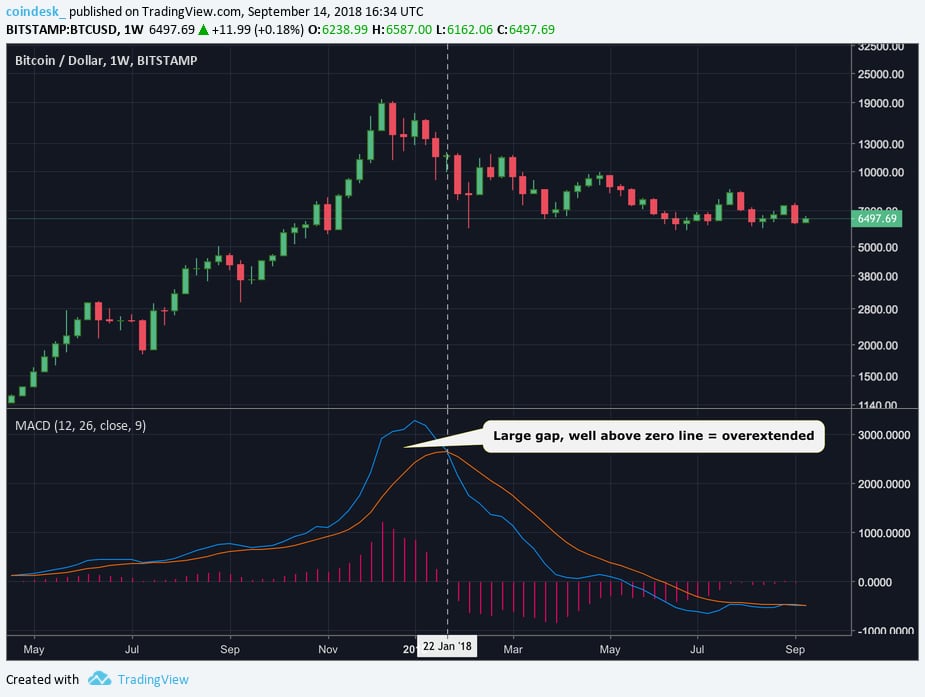
As can be seen, the MACD line began to stray noticeably far away from the signal line in December of 2017. Also at this time, both the MACD and Signal were well above the zero line.

The combination of the two warned investors that the surge in price action was causing over-extended market conditions and a pullback was becoming likely.

Zero line/Histogram

The zero line marks the midpoint of the MACD oscillator. When the 12 EMA crosses above the 26 EMA, the MACD crosses above the zero line, presenting a buy signal. Conversely, when the 12 EMA crosses below the 26 EMA, the MACD crosses below the zero line and presents a sell signal.

The histogram (pink bars) quantifies the distance between the MACD and the signal line. The histogram prints a bar above the zero line when the MACD is above the signal line and prints below when the MACD is below the signal line. The size of the bar depends on the how great the distance is between the two lines.

As you can see in the above chart, the histogram reaches its highest level when the MACD iat its farthest point above the signal line, implying the rally is becoming overstretched.

Once the pullback occurs, the bearish MACD cross and histogram retreating below the zero line cemented the trend in bearish favor.

Conclusion

The MACD is a great tool for the trend following traders, whether you’re a beginner or a professional.

It depicts buy and sell signals simply by the crossing of two lines, so even the most novice traders can quickly become comfortable with the tool.

Disclosure: The author holds BTC, AST, REQ, OMG, FUEL, 1st, and AMP at the time of writing.

Digital Graph Chart via Shutterstock


Source link

Tags: AverageConvergencecryptoDivergenceMovingtrading
Share76Tweet47
Ledger Nano X - The secure hardware wallet
Previous Post

Bridged Stablecoins on Solana Get a Boost With Mercurial Finance Pools — CoinDesk

Next Post

Crypto Trading 101: The Moving Average Crossover

Related Posts

Blockchain Powers Jack Ma’s -B Ant Group Energy Asset Strategy

Blockchain Powers Jack Ma’s $8-B Ant Group Energy Asset Strategy

9 September 2025
0

Trusted Editorial content, reviewed by leading industry experts and seasoned editors. Ad Disclosure According to Bloomberg, Ant Digital Technologies has...

Japan Post Bank To Give Digital Yen Access To .3T Deposits

Japan Post Bank To Give Digital Yen Access To $1.3T Deposits

3 September 2025
0

Trusted Editorial content, reviewed by leading industry experts and seasoned editors. Ad Disclosure Japan Post Bank is moving toward a...

The Blockchain Group Pushes Institutional Crypto Wave in Europe

The Blockchain Group Pushes Institutional Crypto Wave in Europe

10 June 2025
0

Trusted Editorial content, reviewed by leading industry experts and seasoned editors. Ad Disclosure A Bitcoin-focused company based in Paris wants...

Ripple And Japan’s Web3 Salon Spark Asia Innovation

Ripple And Japan’s Web3 Salon Spark Asia Innovation

10 June 2025
0

Trusted Editorial content, reviewed by leading industry experts and seasoned editors. Ad Disclosure Ripple has teamed up with Japan’s Web3...

Blockchain Could Revolutionize What We Eat, Study Reveals

Blockchain Could Revolutionize What We Eat, Study Reveals

5 June 2025
0

Trusted Editorial content, reviewed by leading industry experts and seasoned editors. Ad Disclosure A growing number of experts warn that...

Load More
Next Post

Crypto Trading 101: The Moving Average Crossover

Leave a Reply Cancel reply

Your email address will not be published. Required fields are marked *

Plugin Install : Widget Tab Post needs JNews - View Counter to be installed
  • Trending
  • Comments
  • Latest
Solana Surges as TVL Hits B and Market Cap Overtakes BNB – CoinCentral

Solana Surges as TVL Hits $13B and Market Cap Overtakes BNB – CoinCentral

12 September 2025
Solana (SOL) Price News: Galaxy Scoops Up Over 0M in SOL From Binance, Coinbase – CoinDesk

Solana (SOL) Price News: Galaxy Scoops Up Over $700M in SOL From Binance, Coinbase – CoinDesk

12 September 2025
Can It Reach 500% Gains in September?

Can It Reach 500% Gains in September?

12 September 2025
Retail Skips SHIB and DOGE for a Sub- DeFi Project Targeting 900% Before Year End

Retail Skips SHIB and DOGE for a Sub-$1 DeFi Project Targeting 900% Before Year End

12 September 2025

About Us

We publish a comprehensive news feed covering all news relevant to the crypto user, covering main industry news, politics and regulation as well as consumer-level “news you can use” (practical stuff), including handy DIY tips, links to useful tools, unbiased reviews and opinions revolving around cryptocurrency. Simple logic and real-world examples are preferred before technical jargon and personal rants.

Categories

  • Altcoin
  • ApeCoin
  • Bitcoin
  • Blockchain
  • BNB
  • Cardano
  • Cryptocurrency
  • DOGE
  • DOT
  • Ethereum
  • HBAR
  • Litecoin
  • Market
  • Meta News
  • Mining
  • NFT
  • QNT
  • Regulation
  • SHIBA
  • Solano
  • Tether
  • Uncategorized
  • XDC
  • XLM
  • XRP

What’s New Here!

  • Solana Surges as TVL Hits $13B and Market Cap Overtakes BNB – CoinCentral
  • Solana (SOL) Price News: Galaxy Scoops Up Over $700M in SOL From Binance, Coinbase – CoinDesk
  • Can It Reach 500% Gains in September?
  • Retail Skips SHIB and DOGE for a Sub-$1 DeFi Project Targeting 900% Before Year End
  • SOL Breaks $230, Touches $240 for First Time Since January – Is Solana Season Finally Here? – Cryptonews

Subscribe Now

Our Partner

Round Main Logo
  • About Us
  • Privacy Policy
  • Contact Us

© 2022-2025 coin24h.com

No Result
View All Result
  • Home
  • Cryptocurrency
    • Bitcoin
    • Ethereum
    • XRP
    • Litecoin
    • Altcoin
    • Cardano
    • Tether
    • DOGE
    • Solano
    • XLM
    • DOT
    • XDC
    • SHIBA
    • BNB
    • Ape
    • HBAR
    • QNT
  • Blockchain
  • Regulation
  • Market
  • Live
    • Prices
    • ICO
  • Meta
    • NFT
  • Technical Analysis
    • XRP
    • BTC
    • XLM
    • ADA
    • TETHER
    • ETC
    • ETH
    • DOGE
    • LTC
  • Exchange
  • Mining

© 2020 coin24h.com

Welcome Back!

Login to your account below

Forgotten Password? Sign Up

Create New Account!

Fill the forms below to register

All fields are required. Log In

Retrieve your password

Please enter your username or email address to reset your password.

Log In
  • bitcoinBitcoin (BTC) $ 115,046.00
  • ethereumEthereum (ETH) $ 4,538.33
  • xrpXRP (XRP) $ 3.04
  • tetherTether (USDT) $ 1.00
  • solanaSolana (SOL) $ 239.95
  • bnbBNB (BNB) $ 907.71
  • usd-coinUSDC (USDC) $ 0.999755
  • dogecoinDogecoin (DOGE) $ 0.263215
  • staked-etherLido Staked Ether (STETH) $ 4,530.19
  • tronTRON (TRX) $ 0.348546
  • cardanoCardano (ADA) $ 0.890054
  • wrapped-stethWrapped stETH (WSTETH) $ 5,494.97
  • chainlinkChainlink (LINK) $ 24.49
  • wrapped-beacon-ethWrapped Beacon ETH (WBETH) $ 4,895.36
  • hyperliquidHyperliquid (HYPE) $ 56.23
  • wrapped-bitcoinWrapped Bitcoin (WBTC) $ 115,025.00
  • ethena-usdeEthena USDe (USDE) $ 1.00
  • suiSui (SUI) $ 3.63
  • figure-helocFigure Heloc (FIGR_HELOC) $ 1.04
  • stellarStellar (XLM) $ 0.392511
  • wrapped-eethWrapped eETH (WEETH) $ 4,875.16
  • avalanche-2Avalanche (AVAX) $ 28.59
  • bitcoin-cashBitcoin Cash (BCH) $ 588.56
  • wethWETH (WETH) $ 4,533.41
  • hedera-hashgraphHedera (HBAR) $ 0.241395
  • litecoinLitecoin (LTC) $ 116.35
  • leo-tokenLEO Token (LEO) $ 9.58
  • crypto-com-chainCronos (CRO) $ 0.254254
  • the-open-networkToncoin (TON) $ 3.19
  • usdsUSDS (USDS) $ 0.999628
  • shiba-inuShiba Inu (SHIB) $ 0.000013
  • binance-bridged-usdt-bnb-smart-chainBinance Bridged USDT (BNB Smart Chain) (BSC-USD) $ 1.00
  • coinbase-wrapped-btcCoinbase Wrapped BTC (CBBTC) $ 115,004.00
  • polkadotPolkadot (DOT) $ 4.22
  • whitebitWhiteBIT Coin (WBT) $ 43.70
  • uniswapUniswap (UNI) $ 10.02
  • ethena-staked-usdeEthena Staked USDe (SUSDE) $ 1.20
  • world-liberty-financialWorld Liberty Financial (WLFI) $ 0.201390
  • mantleMantle (MNT) $ 1.63
  • ethenaEthena (ENA) $ 0.753652
  • moneroMonero (XMR) $ 279.75
  • aaveAave (AAVE) $ 314.24
  • bitget-tokenBitget Token (BGB) $ 4.90
  • daiDai (DAI) $ 1.00
  • pepePepe (PEPE) $ 0.000011
  • okbOKB (OKB) $ 197.13
  • memecoreMemeCore (M) $ 2.24
  • jito-staked-solJito Staked SOL (JITOSOL) $ 294.77
  • ondo-financeOndo (ONDO) $ 1.09
  • nearNEAR Protocol (NEAR) $ 2.72