The prices of MYX Finance (MYX) and Starknet (STRK) have witnessed a sharp upswing of over 20% in the past 24 hours, signaling renewed interest in mid-cap altcoins amid Bitcoin’s steady climb toward its all-time high. This sudden momentum has pushed both assets into crucial short-term resistance zones. If bullish sentiment sustains, the MYX price could eye the $0.35 region, while the STRK price may target $0.95. However, failure to maintain buying pressure could trigger a brief consolidation before the next breakout attempt.
MYX Finance Eyes a ‘V-Shaped’ Recovery
Since the beginning, the MYX Finance price seems to have been following a pattern that comprises a breakout followed by a horizontal consolidation. However, the recent fallout had raised some concerns, but the BTC price hitting new highs reclaimed massive bullish momentum. Currently, the price is trying hard to validate a bullish rebound, which may mark a new ATH if it is successful.
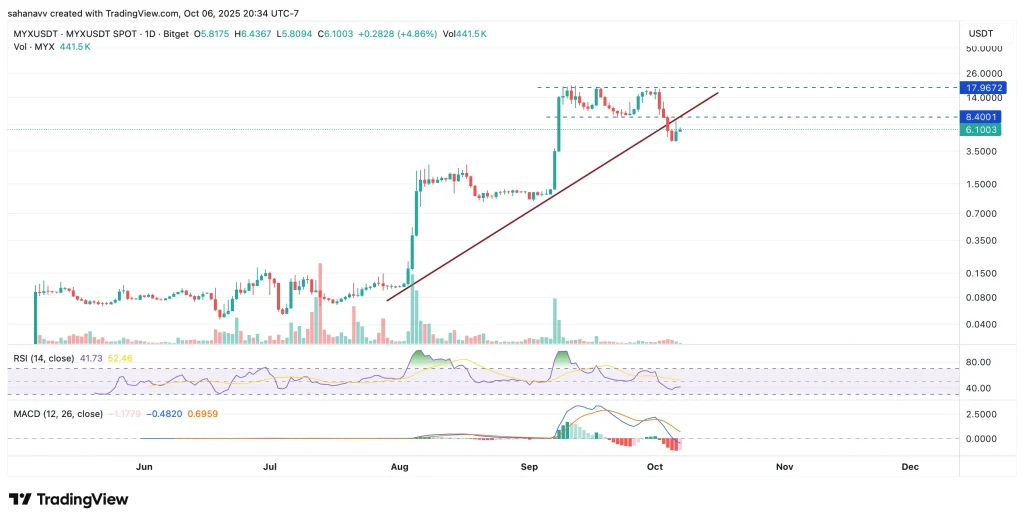
The price has remained largely incremental since August, while the volume has witnessed an occasional increment. The current rebound does not appear to have been backed by a strong buying volume. Although the RSI and MACD point towards a bullish divergence, a rise above the local resistance at $8.4 may validate the move. This level also coincides with the ascending support, which makes these levels extremely important to achieve. Following this, the MYX price may continue to consolidate for a while before marching towards a new ATH at around $20.
Starknet (STRK) Enters Top 100
The Starknet price witnessed a sudden rise in the price followed by a massive influx of buying pressure as the trading volume surged 4 times from $55 million to over $280 million. Soon after the rebound in June, the price remained consolidated between the resistance and support zone before the start of Q4 triggered a strong breakout.
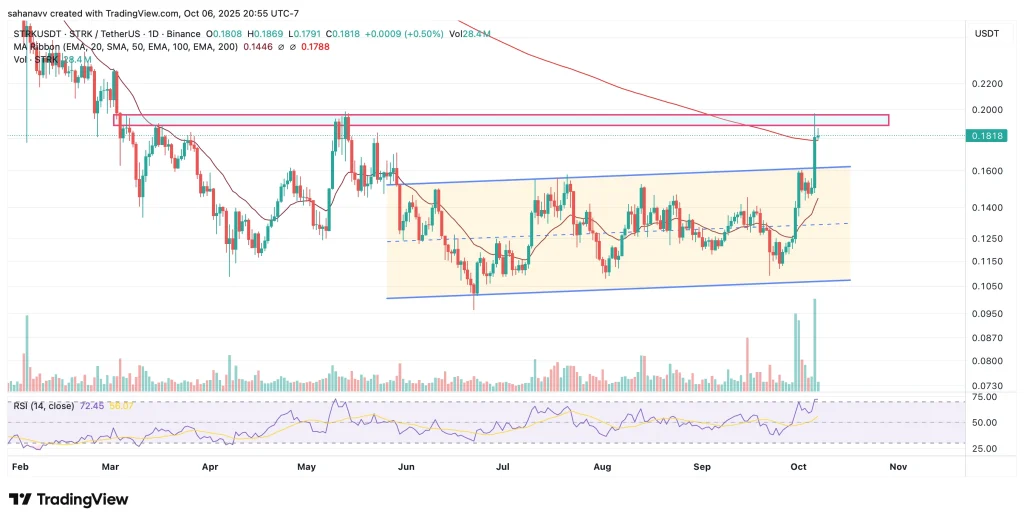
The STRK price has broken above the parallel channel and has found support at the 200-day MA at the moment. The bears are trying hard to push the price below this level; however, the technicals suggest a further upside move could be possible. The RSI is again attempting to sustain within the overbought range while showing the possibility of a bearish divergence. Therefore, if the price may continue to coil up until the 200-day MA at $1.78 offers a strong base, which could propel the rally within the resistance zone between $1.88 and $1.92, further leading it above $2.
Trust with CoinPedia:
CoinPedia has been delivering accurate and timely cryptocurrency and blockchain updates since 2017. All content is created by our expert panel of analysts and journalists, following strict Editorial Guidelines based on E-E-A-T (Experience, Expertise, Authoritativeness, Trustworthiness). Every article is fact-checked against reputable sources to ensure accuracy, transparency, and reliability. Our review policy guarantees unbiased evaluations when recommending exchanges, platforms, or tools. We strive to provide timely updates about everything crypto & blockchain, right from startups to industry majors.
Investment Disclaimer:
All opinions and insights shared represent the author’s own views on current market conditions. Please do your own research before making investment decisions. Neither the writer nor the publication assumes responsibility for your financial choices.
Sponsored and Advertisements:
Sponsored content and affiliate links may appear on our site. Advertisements are marked clearly, and our editorial content remains entirely independent from our ad partners.
 Bitcoin
  Ethereum
  XRP
XRP  Tether
  BNB
BNB  Solana
  USDC
USDC  Dogecoin
  Cardano
  Wrapped stETH
  Wrapped Bitcoin
  Ethena USDe
  Sui
Sui  Stellar
  Figure Heloc
  Avalanche
  Hyperliquid
  Wrapped eETH
  Bitcoin Cash
  WETH
WETH  Hedera
  Litecoin
  LEO Token
  Coinbase Wrapped BTC
  Binance Bridged USDT (BNB Smart Chain)
  USDS
USDS  Shiba Inu
  Toncoin
  Polkadot
  USDT0
USDT0  WhiteBIT Coin
  Ethena Staked USDe
  World Liberty Financial
  OKB
OKB  Aave
Aave  Ethena
  Pepe
Pepe  Aptos
Aptos  NEAR Protocol
  Jito Staked SOL