The total crypto market cap added $37.8 billion to its value for the last seven days and now stands at $396.8 billion. The top 10 currencies are mostly in green for the same period with Litecoin (LTC) leading the pack with a 21.7 percent price increase. By the time of writing bitcoin is trading at $13,090, ether (ETH) is stable at around $406. Ripple (XRP) is at $0.256.
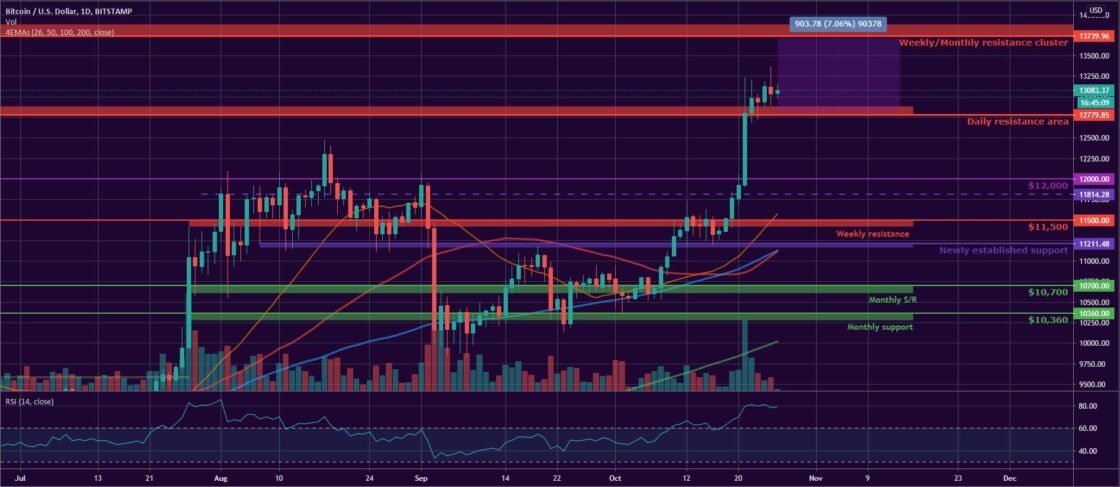
BTC/USD
Bitcoin hit the weekly horizontal resistance at $11,500 on Sunday, October 18 for the third time in six days. It successfully filled the $11,200-$11,500 gap and was ready for take-off as bull pressure was steadily increasing.
The coin closed the week with a 1.2 percent price increase.
On Monday, the BTC/USD pair formed its third consecutive green candle on the daily chart and climbed up to $11,758. We were looking at $11,800 as the next zone of temporary resistance.
The price of bitcoin, however, continued to surge and on Tuesday, October 20 it surpassed the mentioned level, stopping at $11,900. Buyers were able to push the price above the $12k mark for the first time since September 1 during intraday.
What we saw in the mid-week session on Wednesday was the biggest one-day gain for BTC since July 27. The leading cryptocurrency added 7.4 percent to its value and closed the trading day at $12,823. It was seen as high as $13,218 at some point thus breaking the $13,000 line. That level was last reached in July 2019.
On Thursday, October 22, bitcoin confirmed its presence above the daily resistance area formed around $12,800, and closed the day at $12,996, registering one more failed attempt to break that level.
The last day of the workweek came with a short correction to $12,932, but the bear pressure was still weak to cause any disturbances in the current trend.
On Saturday, October 24, the BTC/USD pair resumed its march up and hit $13,115. Buyers were already looking at $13,250 as the next temporary resistance on their way up to the weekly/monthly resistance cluster around $13,750-$13,800.
The coin was trading in the $12,900-$13,380 zone on Sunday and ended the week with a small loss to $13,035.
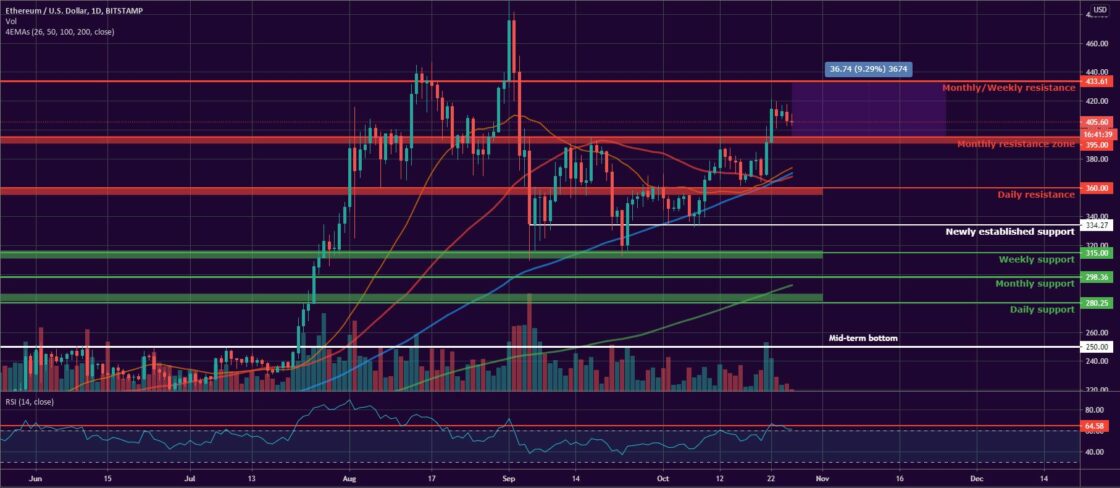
ETH/USD
The Ethereum Project token ETH climbed up to $378 on Sunday, October 18 after rebounding from the 50-day EMA earlier in the session. It also found support at the $360 horizontal line on the previous day.
The coin closed the seven-day period with a 1.3 percent price increase.
On Monday, the ETH/USD pair remained flat near the above-mentioned level as bulls were looking for a stabilization period that could be later used as a base for a short to mid-term upward movement extension.
The Tuesday session was a bad one for buyers and they lost their current positions. Unlike BTC, they could not establish an uptrend due to low buyer interest compared to the biggest cryptocurrency. The ether dropped down to $368.
The mid-week trading on Wednesday brought a trend reversal. The ETH token climbed all the way up to $391 and entered the monthly resistance zone. All this resulted in a 6 percent increase.
On Thursday, October 22, ETH consolidated above the resistance zone and added $24 to its value to close the day at $415. The next stop for the coin was to fully fill the gap to the next monthly resistance at $434.
What we saw on Friday though, was a slight correction in price. The profit-taking activities resulted in a drop to $410, but the overall uptrend was preserved.
The first day of the weekend came with a short green candle to $413. On Sunday, October 25, bulls started to show signs of exhaustion. The ETH token fell to $406, but the technical setup was pointing to a bull flag pattern formation on the daily chart.
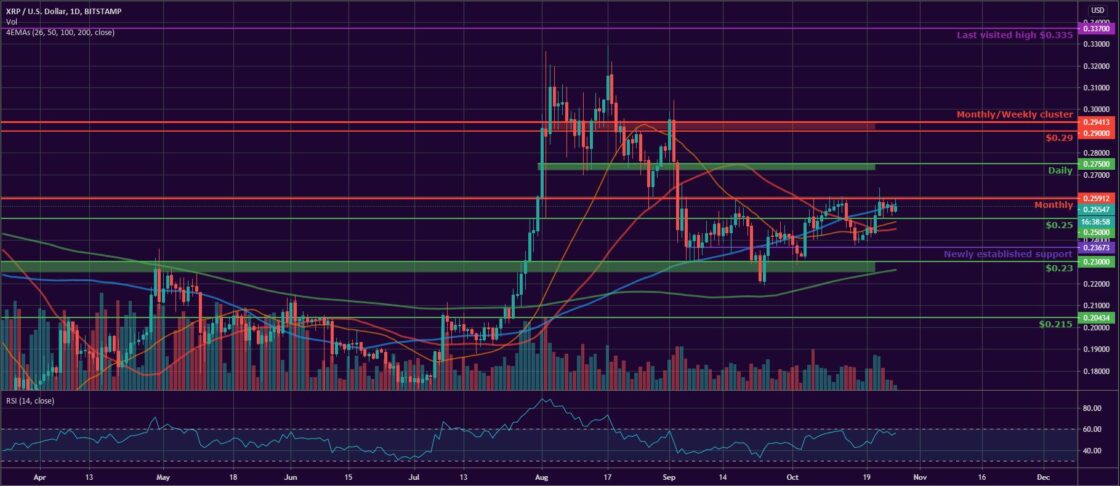
XRP/USD
The Ripple company token XRP climbed up to $0.242 on Sunday, October 18 after rebounding from the local bottom at $0.237 two days earlier. The coin lost 5 percent of its value on a weekly basis and was now trading below all short term EMAs.
The XRP/USD pair opened the new period by moving in the $0.25 -$0.24 zone during intraday on Monday. It formed a short green candle at the end of the session and closed near the 50-day EMA at $0.245.


On Tuesday, October 20, the major altcoin fell down to $0.243 after once again hitting the horizontal resistance at $0.25 in the early hours.
The mid-week session on Wednesday was a good one for bulls. The price of XRP skyrocketed to $0.256 before stabilizing at $0.251 at the end of the day. The move resulted in a 3.2 percent increase.
On Thursday, October 22, the “ripple” continued to surge and successfully broke above the monthly resistance at $0.259. Still, bears were not yet ready to give up their territory and reduced the losses to $0.257.
The last day of the workweek came with a short pullback to $0.254. The XRP token found its dynamic support at the 50-day EMA after it was rejected at the already mentioned horizontal resistance.
The weekend of October 24-25 started with a low volatility session on Saturday during which the coin registered an increase to $0.256. Then on Sunday, the coin dropped to $0.253.
Altcoin of the Week
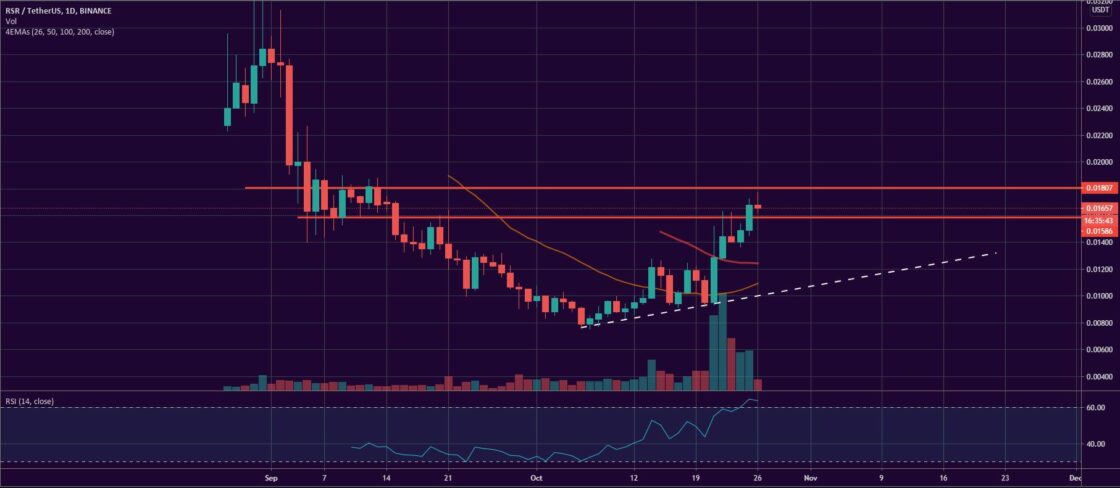
Our Altcoin of the week is Reserve Rights Token (RSR). The so-called “flexible pool of stablecoins” aims to provide end-user with an inflation-free, low-risk cryptocurrency that is fully decentralized.
The RSR added 62 percent to its value on a weekly basis and is 87 percent up for the last fourteen days. The coin moved up to #73 on the CoinGecko Top 100 list with a total market capitalization of approximately $159 million.
It reached a weekly high of $0.0174 on Sunday, October 25 and as of the time of writing is trading at $0.0165 against USDT on Binance.
Like BTCMANAGER? Send us a tip!
Our Bitcoin Address: 3AbQrAyRsdM5NX5BQh8qWYePEpGjCYLCy4