
On Friday, the price of Bitcoin experienced a drop, which saw the price fall from $71,310 to $65,370. The price is retracing at the moment, and there are possibilities that it could still move downward. At this point, it could be that BTC’s price is losing steam and headed for a downward shift.
At the time of writing, the price of BTC was up by 0.9%, trading around $67,734 below the 4-hour 100-day moving average in the last 24 hours. However, in the daily timeframe, the price is still trading above the 100-day moving average.
Bitcoin On The 4-hour Chart
Looking at the 4-hour timeframe chart, Bitcoin is already trading below the 100-day moving average and trying to break below the trend line. The price could start a new trend downward if it manages to break below the trend line.
Also, with the help of the MACD indicator, the MACD histogram is trending below the MACD zero line. Both the MACD line and the signal line are trying to cross below the MACD zero line. This formation of the MACD indication simply suggests that the price could move downward.
Using the Relative Strength Index (RSI) to also analyze the price action in the 4-hour timeframe, the RSI line is already trending at the oversold section below the 50% level, suggesting a bearish trend might be on the horizon.
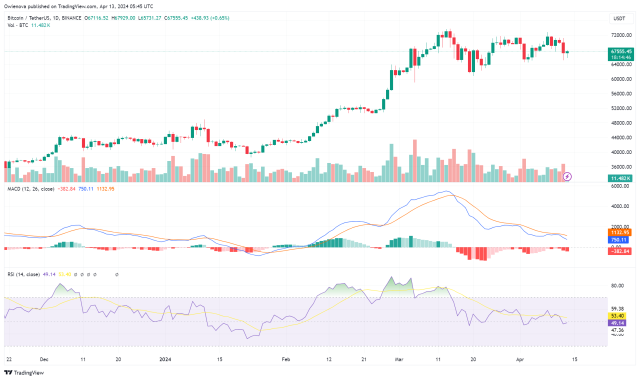
BTC On The Daily Chart
Although the price is still trading above the 100-day moving average in the daily timeframe, the MACD histogram is already trending below the MACD zero line. Also, the MACD line and Signal are heading toward the MACD zero line, which could be a strong indication that prices could drop.
Looking at the chart with the RSI indicator, the RSI line is trending slightly below the 50% level, indicating that the price might move downward and potentially start a bearish trend.
Bitcoin might start a downward correction movement if the price experiences a drop after this retracement. Additionally, if this downward correction starts, it might move toward its previous low of $64,625.81, and a break out from this level will trigger a bearish trend.
On the contrary, if the price of Bitcoin fails to break below its previous low, it could continue in its upward direction toward its previous high of $73,010, and if the price manages to break above this level, it might move even further to create a new high.
Featured image from iStock, chart from Tradingview.com
 Bitcoin
  Ethereum
  Tether
  BNB
BNB  XRP
XRP  Solana
  USDC
USDC  Dogecoin
  Figure Heloc
  Cardano
  Wrapped stETH
  Bitcoin Cash
  WhiteBIT Coin
  Wrapped Bitcoin
  Wrapped eETH
  USDS
USDS  Binance Bridged USDT (BNB Smart Chain)
  LEO Token
  WETH
WETH  Stellar
  Coinbase Wrapped BTC
  Sui
Sui  Ethena USDe
  Zcash
Zcash  Avalanche
  Litecoin
  Hyperliquid
  Canton
  Shiba Inu
  Hedera
  World Liberty Financial
  USDT0
USDT0  sUSDS
sUSDS  Toncoin
  Ethena Staked USDe
  Polkadot
  USD1
USD1  MemeCore
  Bittensor