
BNB price started a recovery wave from the $585 support zone. The bulls must clear the $600 resistance zone to push the price into a positive zone in the near term.
- BNB price extended losses and tested the $585 support zone.
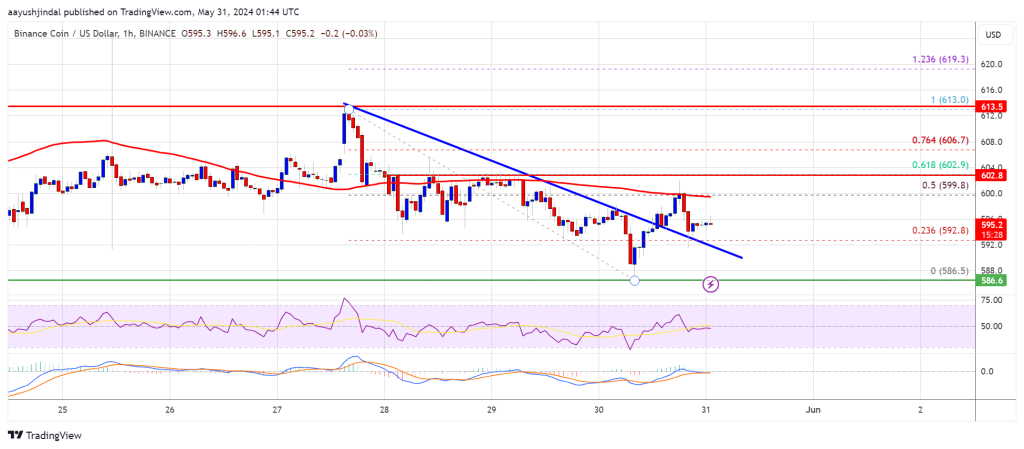
- The price is now trading below $600 and the 100-hourly simple moving average.
- There was a break above a key bearish trend line with resistance at $595 on the hourly chart of the BNB/USD pair (data source from Binance).
- The pair could start a fresh increase if it stays above the $585 support.
BNB Price Holds Support
After a decent increase, BNB price struggled near the $615 resistance. As a result, there was a bearish reaction below the $600 support, like Ethereum and Bitcoin.
The price dipped below the $595 support and the 100 simple moving average (4 hours). It traded as low as $586 and recently started a recovery wave. There was a move above the $595 resistance zone, and the 23.6% Fib retracement level of the downward move from the $613 swing high to the $586 low.
There was a break above a key bearish trend line with resistance at $595 on the hourly chart of the BNB/USD pair. However, the bears were active near the $600 level or the 50% Fib retracement level of the downward move from the $613 swing high to the $586 low.
The price is now trading below $600 and the 100-hourly simple moving average. Immediate resistance is near the $600 level. The next resistance sits near the $602 level.
A clear move above the $602 zone could send the price higher. In the stated case, BNB price could test $615. A close above the $615 resistance might set the pace for a larger increase toward the $620 resistance. Any more gains might call for a test of the $632 level in the coming days.
More Losses?
If BNB fails to clear the $600 resistance, it could continue to move down. Initial support on the downside is near the $592 level and the trend line.
The next major support is near the $585 level. The main support sits at $572. If there is a downside break below the $572 support, the price could drop toward the $560 support. Any more losses could initiate a larger decline toward the $550 level.
Technical Indicators
Hourly MACD – The MACD for BNB/USD is losing pace in the bearish zone.
Hourly RSI (Relative Strength Index) – The RSI for BNB/USD is currently below the 50 level.
Major Support Levels – $585 and $572.
Major Resistance Levels – $600 and $602.
Credit: Source link
 Bitcoin
  Ethereum
  Tether
  BNB
BNB  XRP
XRP  Wrapped SOL
  USDC
USDC  Dogecoin
  Cardano
  Wrapped stETH
  Wrapped Bitcoin
  Hyperliquid
  Bitcoin Cash
  Wrapped eETH
  Ethena USDe
  Stellar
  USDS
USDS  Binance Bridged USDT (BNB Smart Chain)
  LEO Token
  WETH
WETH  Hedera
  Sui
Sui  Coinbase Wrapped BTC
  Avalanche
  Litecoin
  USDT0
USDT0  WhiteBIT Coin
  Shiba Inu
  Toncoin
  Zcash
Zcash  Ethena Staked USDe
  Figure Heloc
  Polkadot
  MemeCore
  Bittensor
  World Liberty Financial
  sUSDS
sUSDS  Aave
Aave  OKB
OKB  USD1
USD1