- On Friday, Ethereum plunged lower as the price of gold and stocks dived.
- The markets were hurt by news that the plan for the next U.S. stimulus bill fell through, though President Trump stepped in with executive orders.
- ETH hit a low of around $360 during Friday’s trading session.
- Ethereum has since bounced back to $390 as of this article’s writing, buoyed by altcoins.
- Analysts think that the cryptocurrency may be nearing a top, though. They cite technical chart patterns.
Ethereum May Be Printing a Textbook Adam & Eve Top: Analyst
Ethereum is setting itself up for a drop towards the low-$300s, say a number of analysts after recent price action.
One cryptocurrency trader shared the chart below on August 7th. It shows that ETH’s recent price action since the end of July looks eerily similar to the textbook “Adam and Eve” top. Cryptocurrencies have printed Adam and Eve bottoms and tops on multiple occasions over the past few years.
Chart of ETH's price action since the end of July with analysis by trader "Edward Morra" (@Edwardmorra_BTC on Twitter). Chart from TradingView.com
The same trader noted in a later analysis that he thinks the cryptocurrency looks primed to retest $375 after the ongoing rebound: “Price tagged weekly open perfectly to the pip, now I’m watching how it reacts to retesting the breakdown point, might look for hedge short around that area if price action weak.”
The aforementioned trader isn’t the only one predicting an ETH correction in the days ahead.
As reported by Bitcoinist previously, one trader shared the chart below on August 8th. It shows that the cryptocurrency is looking to move towards the $300 as that would line up with the “Fibonacci and horizontal confluence.”
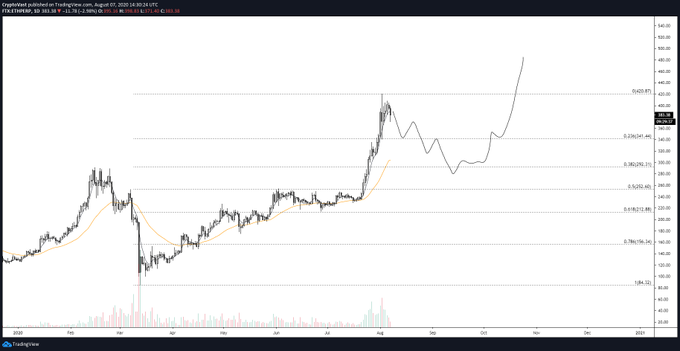
Chart of ETH's price action since the start of the year with analysis by trader "Vast" (@Cryptovast on Twitter). Chart from TradingView.com
All Eyes on Bitcoin
Ethereum’s price action is dependent on Bitcoin at the end of the day.
Fortunately for bulls, analysts are doubling down on their BTC optimism as the asset managed to hold $11,500 after yesterday’s drop.
The pseudonymous analyst “PentarhUdi,” who has predicted almost everyone one of Bitcoin’s major moves over the past three years, shared bullish sentiment last weekend:
“This is not more than 4 months prediction, as I spotted new bullish channel . According to my idea price may reach ATH area in 2 months with following some triangle-like consolidation. For EW lovers – I think price is in starting local III wave with all 3rd-wave-specific bullish drama around. Wave length is around 2 months.”

Chart from TradingView.com
Analysts also say that the fundamentals of this market are stronger than ever as a discussion about more monetary and fiscal stimulus continues.
Featured Image from Shutterstock
Price tags: ethusd, ethbtc
Charts from TradingView.com
Ethereum May Be Forming a Textbook Top Despite Bounce From $360 Lows
 Bitcoin
  Ethereum
  Tether
  XRP
XRP  BNB
BNB  USDC
USDC  Dogecoin
  Figure Heloc
  Cardano
  Wrapped stETH
  Bitcoin Cash
  WhiteBIT Coin
  Wrapped Bitcoin
  Wrapped eETH
  USDS
USDS  Binance Bridged USDT (BNB Smart Chain)
  LEO Token
  WETH
WETH  Stellar
  Coinbase Wrapped BTC
  Sui
Sui  Zcash
Zcash  Ethena USDe
  Avalanche
  Litecoin
  Hyperliquid
  Canton
  Hedera
  Shiba Inu
  USDT0
USDT0  sUSDS
sUSDS  World Liberty Financial
  Toncoin
  Ethena Staked USDe
  USD1
USD1  Polkadot
  MemeCore
  Bittensor
  Aave
Aave