
SHIB price (Shiba Inu) is struggling below the $0.000008 resistance against the US Dollar. Shiba Inu could start a recovery wave if it settles above $0.000008.
- Shiba Inu price extended its decline and tested the $0.0000074 zone against the US Dollar.
- The price is now trading below $$0.000008 and the 100 simple moving average (4 hours).
- There is a key bearish trend line forming with resistance near $0.0000077 on the 4-hour chart of the SHIB/USD pair (data source from Kraken).
- The pair could start a recovery wave if it clears the $0.0000078 and $0.0000080 levels.
SHIB Price Faces Uphill Task
In the past few days, SHIB price saw a steady decline below the $0.0000088 level. The bears were able to push the price below the key support at $0.0000080.
Finally, Shiba Inu found support near the $0.0000074 zone. A low is formed near $0.00000739 and the price is now attempting a recovery wave, like Bitcoin and Ethereum. It is now consolidating near the 23.6% Fib retracement level of the downward move from the $0.00000845 swing high to the $0.00000739 low.
However, SHIB price is trading below $$0.000008 and the 100 simple moving average (4 hours). Besides, there is a key bearish trend line forming with resistance near $0.0000077 on the 4-hour chart of the SHIB/USD pair.
On the upside, the bears are protecting the $0.0000077 level and the trend line. The next major resistance is near the $0.0000078 level or the 50% Fib retracement level of the downward move from the $0.00000845 swing high to the $0.00000739 low.
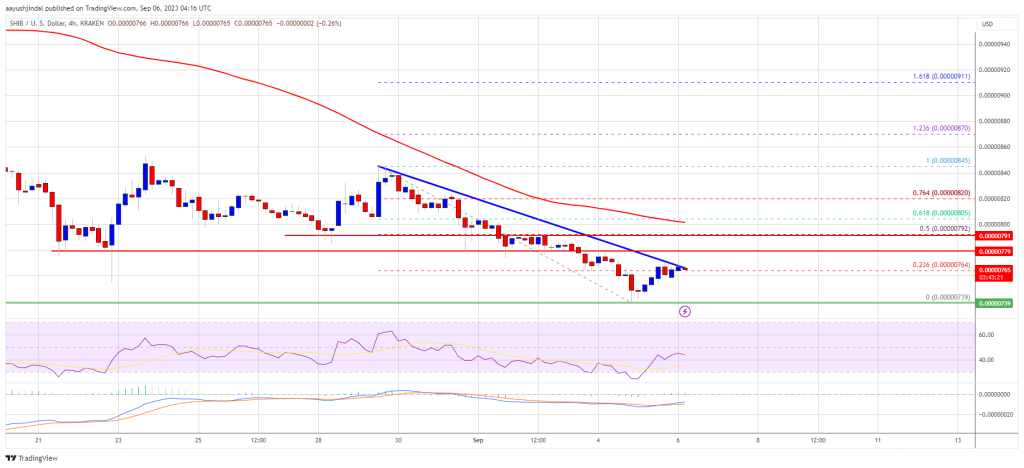
Source: SHIBUSD on TradingView.com
The main resistance is now forming near the $0.0000080 level. A close above the $0.0000080 level might send the price toward the $0.0000088 level. Any more gains might send the price towards the $0.0000092 level.
More Losses In Shiba Inu?
If Shiba Inu price fails to clear the $0.0000078 resistance, it could start another decline. Initial support on the downside is near the $0.0000075 level.
The first major support is near the $0.0000074 level. The next major support is near the $0.0000072 level. If there is a downside break below the $0.0000072 support, there could be an extended decline towards the $0.0000070 zone.
Technical Indicators
4 Hours MACD – The MACD for SHIB/USD is losing pace in the bearish zone.
4 Hours RSI (Relative Strength Index) – The RSI for SHIB/USD is currently below the 50 level.
Major Support Levels – $0.0000075 and $0.000074.
Major Resistance Levels – $0.0000078, $0.0000080 and $0.0000088.
Credit: Source link
 Bitcoin
  Ethereum
  Tether
  XRP
XRP  BNB
BNB  USDC
USDC  Dogecoin
  Figure Heloc
  Cardano
  Bitcoin Cash
  Wrapped stETH
  WhiteBIT Coin
  Wrapped Bitcoin
  USDS
USDS  Wrapped eETH
  Binance Bridged USDT (BNB Smart Chain)
  LEO Token
  WETH
WETH  Stellar
  Zcash
Zcash  Coinbase Wrapped BTC
  Sui
Sui  Ethena USDe
  Litecoin
  Hyperliquid
  Avalanche
  Shiba Inu
  Hedera
  Canton
  sUSDS
sUSDS  World Liberty Financial
  USDT0
USDT0  Toncoin
  Ethena Staked USDe
  Polkadot
  USD1
USD1  MemeCore
  Bittensor
  Pepe
Pepe