Ripple started a major decline below the $0.5000 support zone against the US Dollar. XRP price even broke the $0.4500 support and it seems like there are chances of more losses.
- Ripple started a steady decline below the $0.5000 and $0.4800 levels against the US dollar.
- The price is now trading well below $0.4750 and the 100 simple moving average (4-hours).
- There is a major declining channel forming with resistance near $0.5330 on the 4-hours chart of the XRP/USD pair (data source from Kraken).
- The pair is likely to continue lower if there is a clear break below the $0.4350 level.
Ripple’s XRP Price is Gaining Bearish Momentum
Yesterday, we discussed the chances of a sharp decline in ripple’s XRP price below $0.4750. There was no recovery wave and the price started a sharp decline below the $0.4800 and $0.4750 support levels.
There was a break below the $0.4500 support and the price settled well below the 100 simple moving average (4-hours). A new monthly low is formed near $0.4352 and the price is currently consolidating losses. An initial resistance on the upside is near the $0.4650 level.
The first major resistance is near the $0.4720 level. It is close to the 50% Fib retracement level of the downward move from the $0.5944 high to $0.4352 swing low.
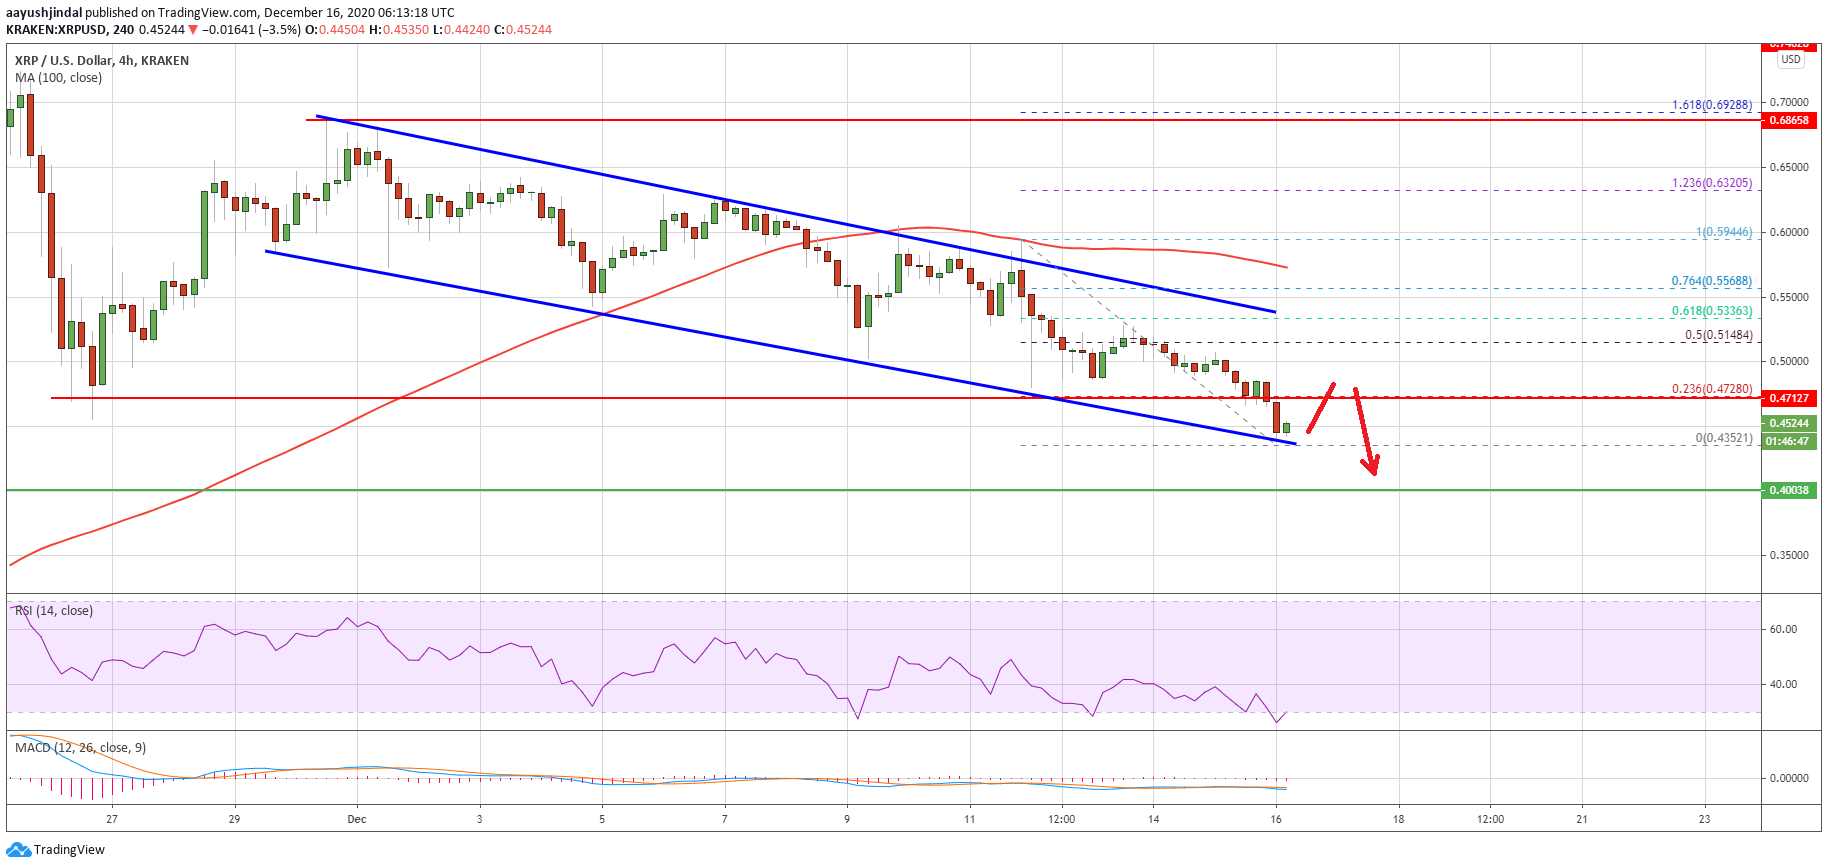
Source: XRPUSD on TradingView.com
The main resistance is now forming near the $0.5000 zone. There is also a major declining channel forming with resistance near $0.5330 on the 4-hours chart of the XRP/USD pair. If there is no recovery wave above $0.4650 or $0.4720, there is a risk of another decline.
The next major support is near the $0.4200 level. Any more losses could lead the price towards the $0.4000 support zone in the near term.
Recovery in XRP?
If ripple starts a decent recovery wave above the $0.4650 resistance, the bulls might attempt to take control. A clear break above the $0.4650 and $0.4720 levels could start a decent recovery.
To move into a positive zone, the price has to settle above the $0.5000 level. A close above $0.5000 will most likely pump the price towards the $0.5500 level.
Technical Indicators
4-Hours MACD – The MACD for XRP/USD is gaining momentum in the bearish zone.
4-Hours RSI (Relative Strength Index) – The RSI for XRP/USD is trying to recover from the oversold zone.
Major Support Levels – $0.4350, $0.4200 and $0.4000.
Major Resistance Levels – $0.4650, $0.4720 and $0.5000.
 Bitcoin
  Ethereum
  Tether
  BNB
BNB  XRP
XRP  USDC
USDC  Dogecoin
  Figure Heloc
  Cardano
  WhiteBIT Coin
  Wrapped stETH
  Bitcoin Cash
  Wrapped Bitcoin
  USDS
USDS  Binance Bridged USDT (BNB Smart Chain)
  Wrapped eETH
  LEO Token
  WETH
WETH  Hyperliquid
  Stellar
  Zcash
Zcash  Ethena USDe
  Coinbase Wrapped BTC
  Litecoin
  Sui
Sui  Avalanche
  Hedera
  sUSDS
sUSDS  Shiba Inu
  USDT0
USDT0  Toncoin
  World Liberty Financial
  Ethena Staked USDe
  Polkadot
  Aave
Aave  MemeCore
  USD1
USD1  Canton
  Bittensor