- XLM price consolidation provides an early warning that a breakout is about to happen.
- Two hypothetical trade ideas were identified – one long and one short.
- Traders look to capitalize on any clear move.
XLM price remains one of the most underwhelming major cryptocurrencies and a laggard with respect to its most recent price action. XLM is currently positioned for ideal trade setups on the long and short sides of the market. The two trade ideas identified in this article are based on two different sized Point and Figure charts.
XLM price has profit potential for bulls and bears alike
XLM price action shows there is a hypothetical trade idea for the short side of the market. The $0.025/3-box Point and Figure chart shows a constriction of price action with a possible bearish continuation pattern on the 3-box reversal. The short idea is an entry at $0.3250, a stop loss at $0.4000, and a projected profit target at $0.0700. This is the least likely setup, given the bullish nature of the aggregate cryptocurrency market.
XLM/USD $0.025/3-box Reversal Point and Figure Chart
On the long side of the trade, XLM has a very ideal bullish setup. The most recent X-column broke the dominant bear market angle and converted the $0.01/3-box Point and Figure chart to a bull market. The current O-column is the first pullback from that bullish breach. The hypothetical trade for the long side of the market is the 3-box reversal of Xs. Currently, that entry would occur at $0.4000 with a stop loss at $0.3600 and a projected profit target at $0.57.
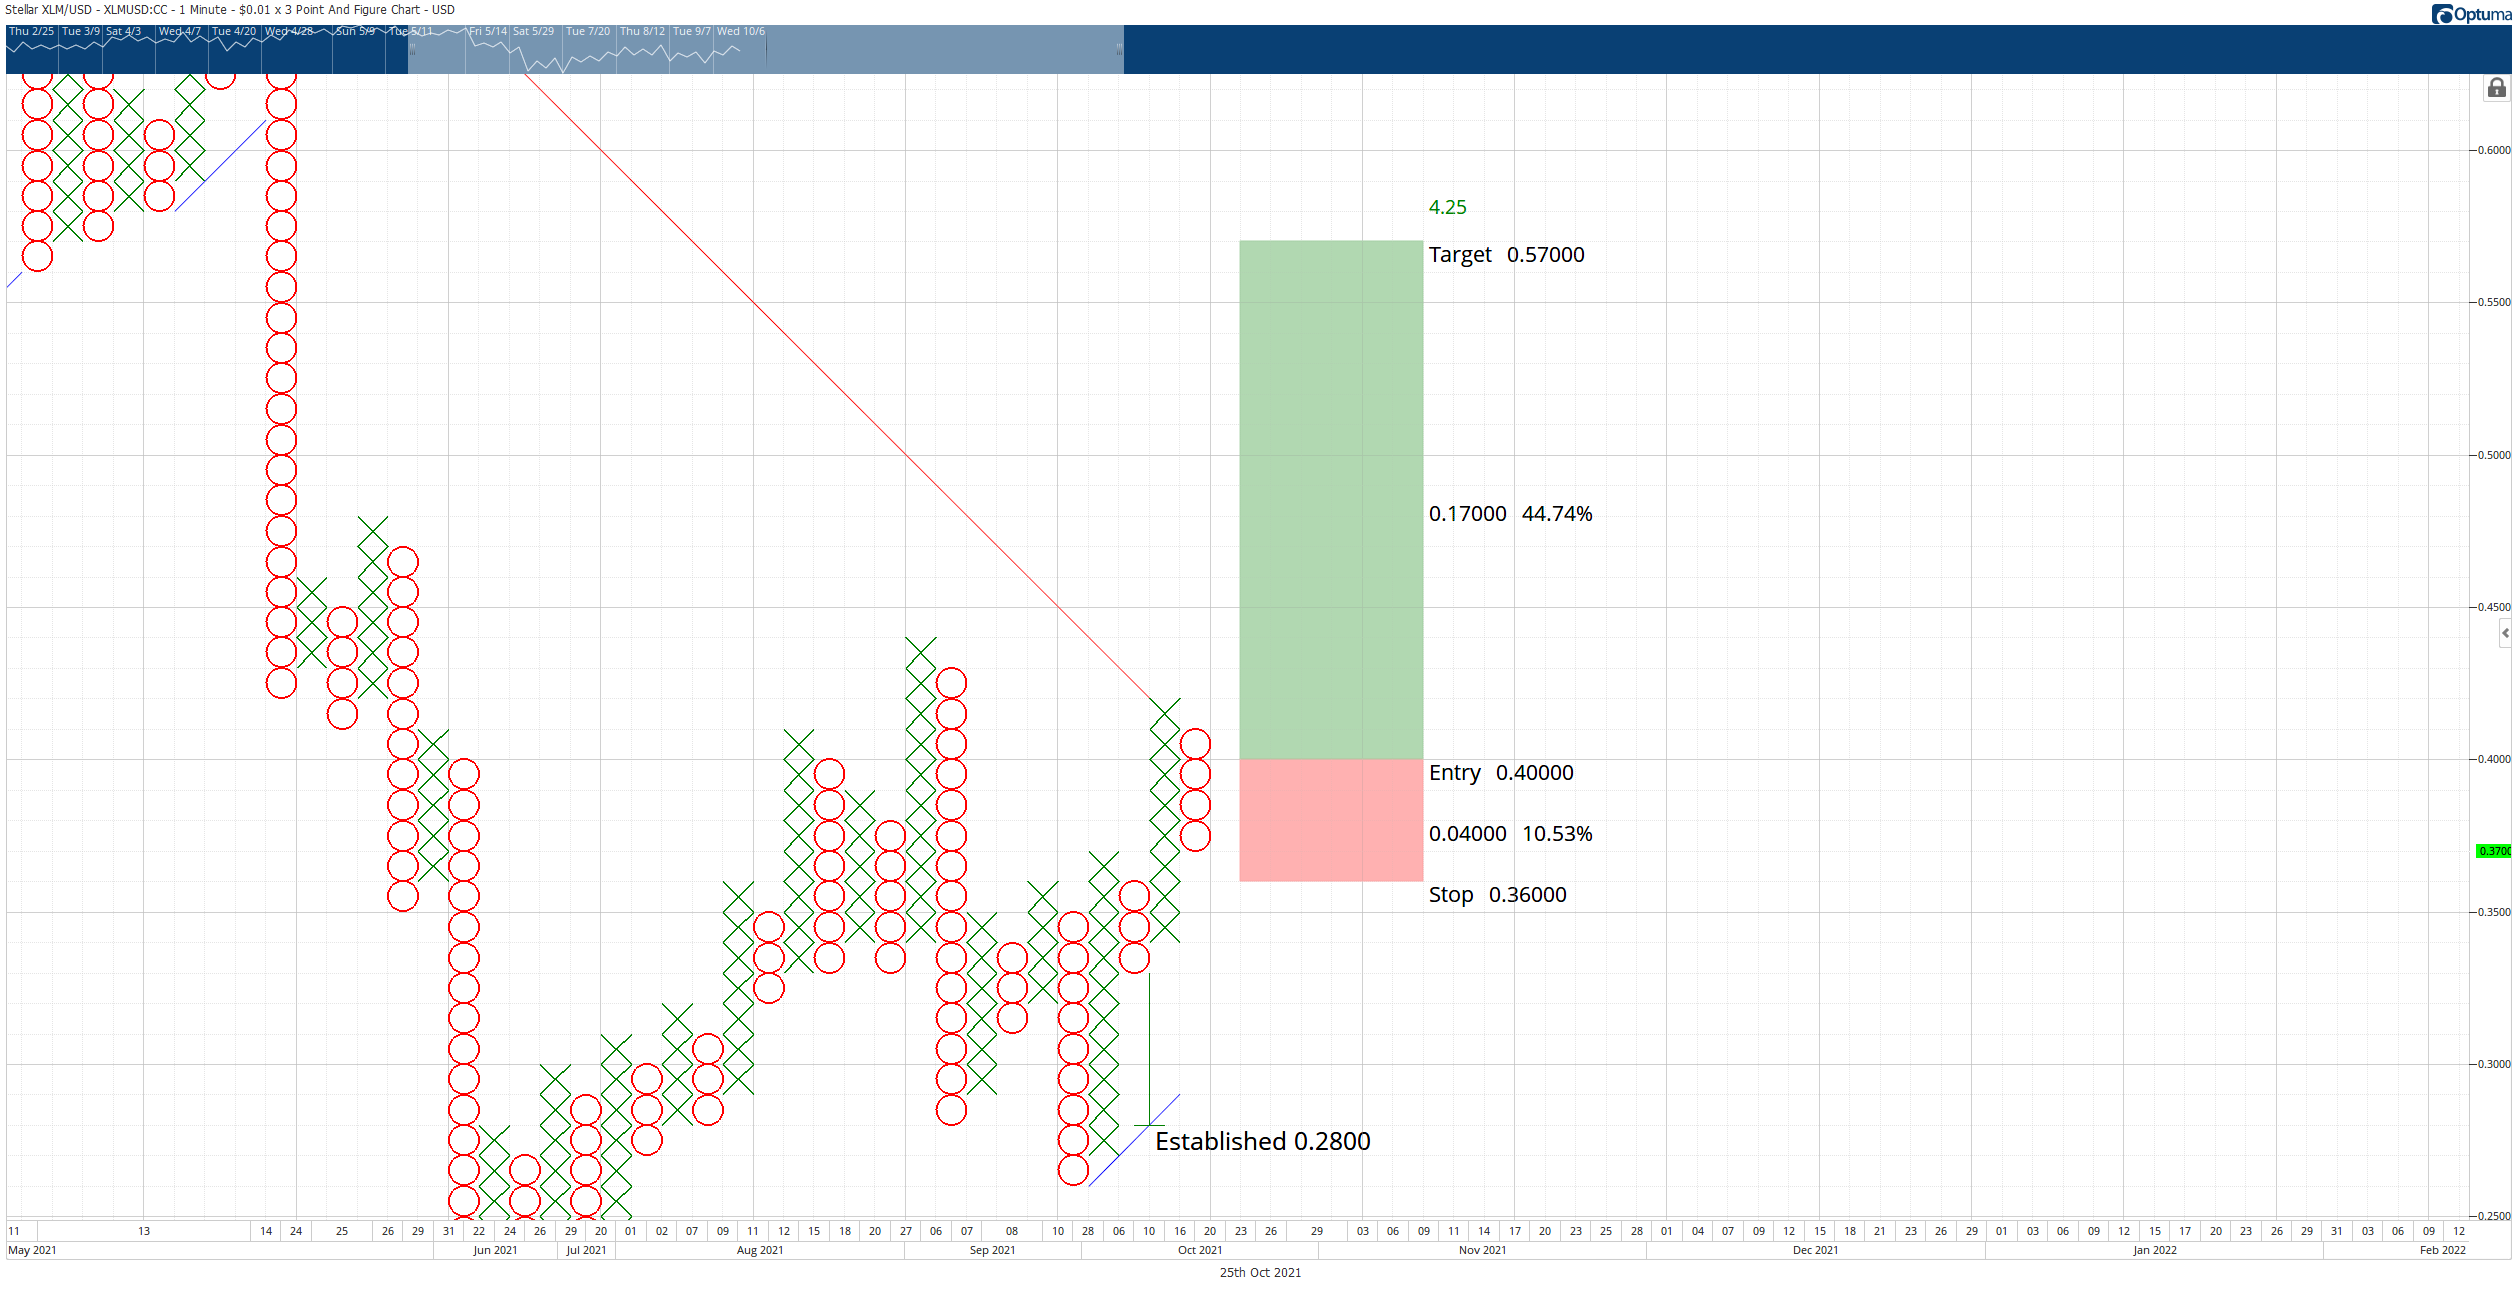
XLM/USD $0.01/3-box Reversal Point and Figure Chart
The long entry idea has the highest positive expectancy rate given the present trend and overall sentiment. Additionally, the $057 target may be entirely too conservative given that XLM price has been a significant laggard and has yet to create a new all-time high.
Credit: Source link
 Bitcoin
  Ethereum
  Tether
  XRP
XRP  BNB
BNB  USDC
USDC  Dogecoin
  Cardano
  Figure Heloc
  WhiteBIT Coin
  Wrapped stETH
  Wrapped Bitcoin
  Bitcoin Cash
  USDS
USDS  Hyperliquid
  LEO Token
  Binance Bridged USDT (BNB Smart Chain)
  Stellar
  WETH
WETH  Wrapped eETH
  Ethena USDe
  Zcash
Zcash  Coinbase Wrapped BTC
  Litecoin
  Hedera
  Avalanche
  Sui
Sui  Shiba Inu
  World Liberty Financial
  sUSDS
sUSDS  Toncoin
  Ethena Staked USDe
  USDT0
USDT0  Polkadot
  Canton
  Bittensor
  Aave
Aave  USD1
USD1  MemeCore