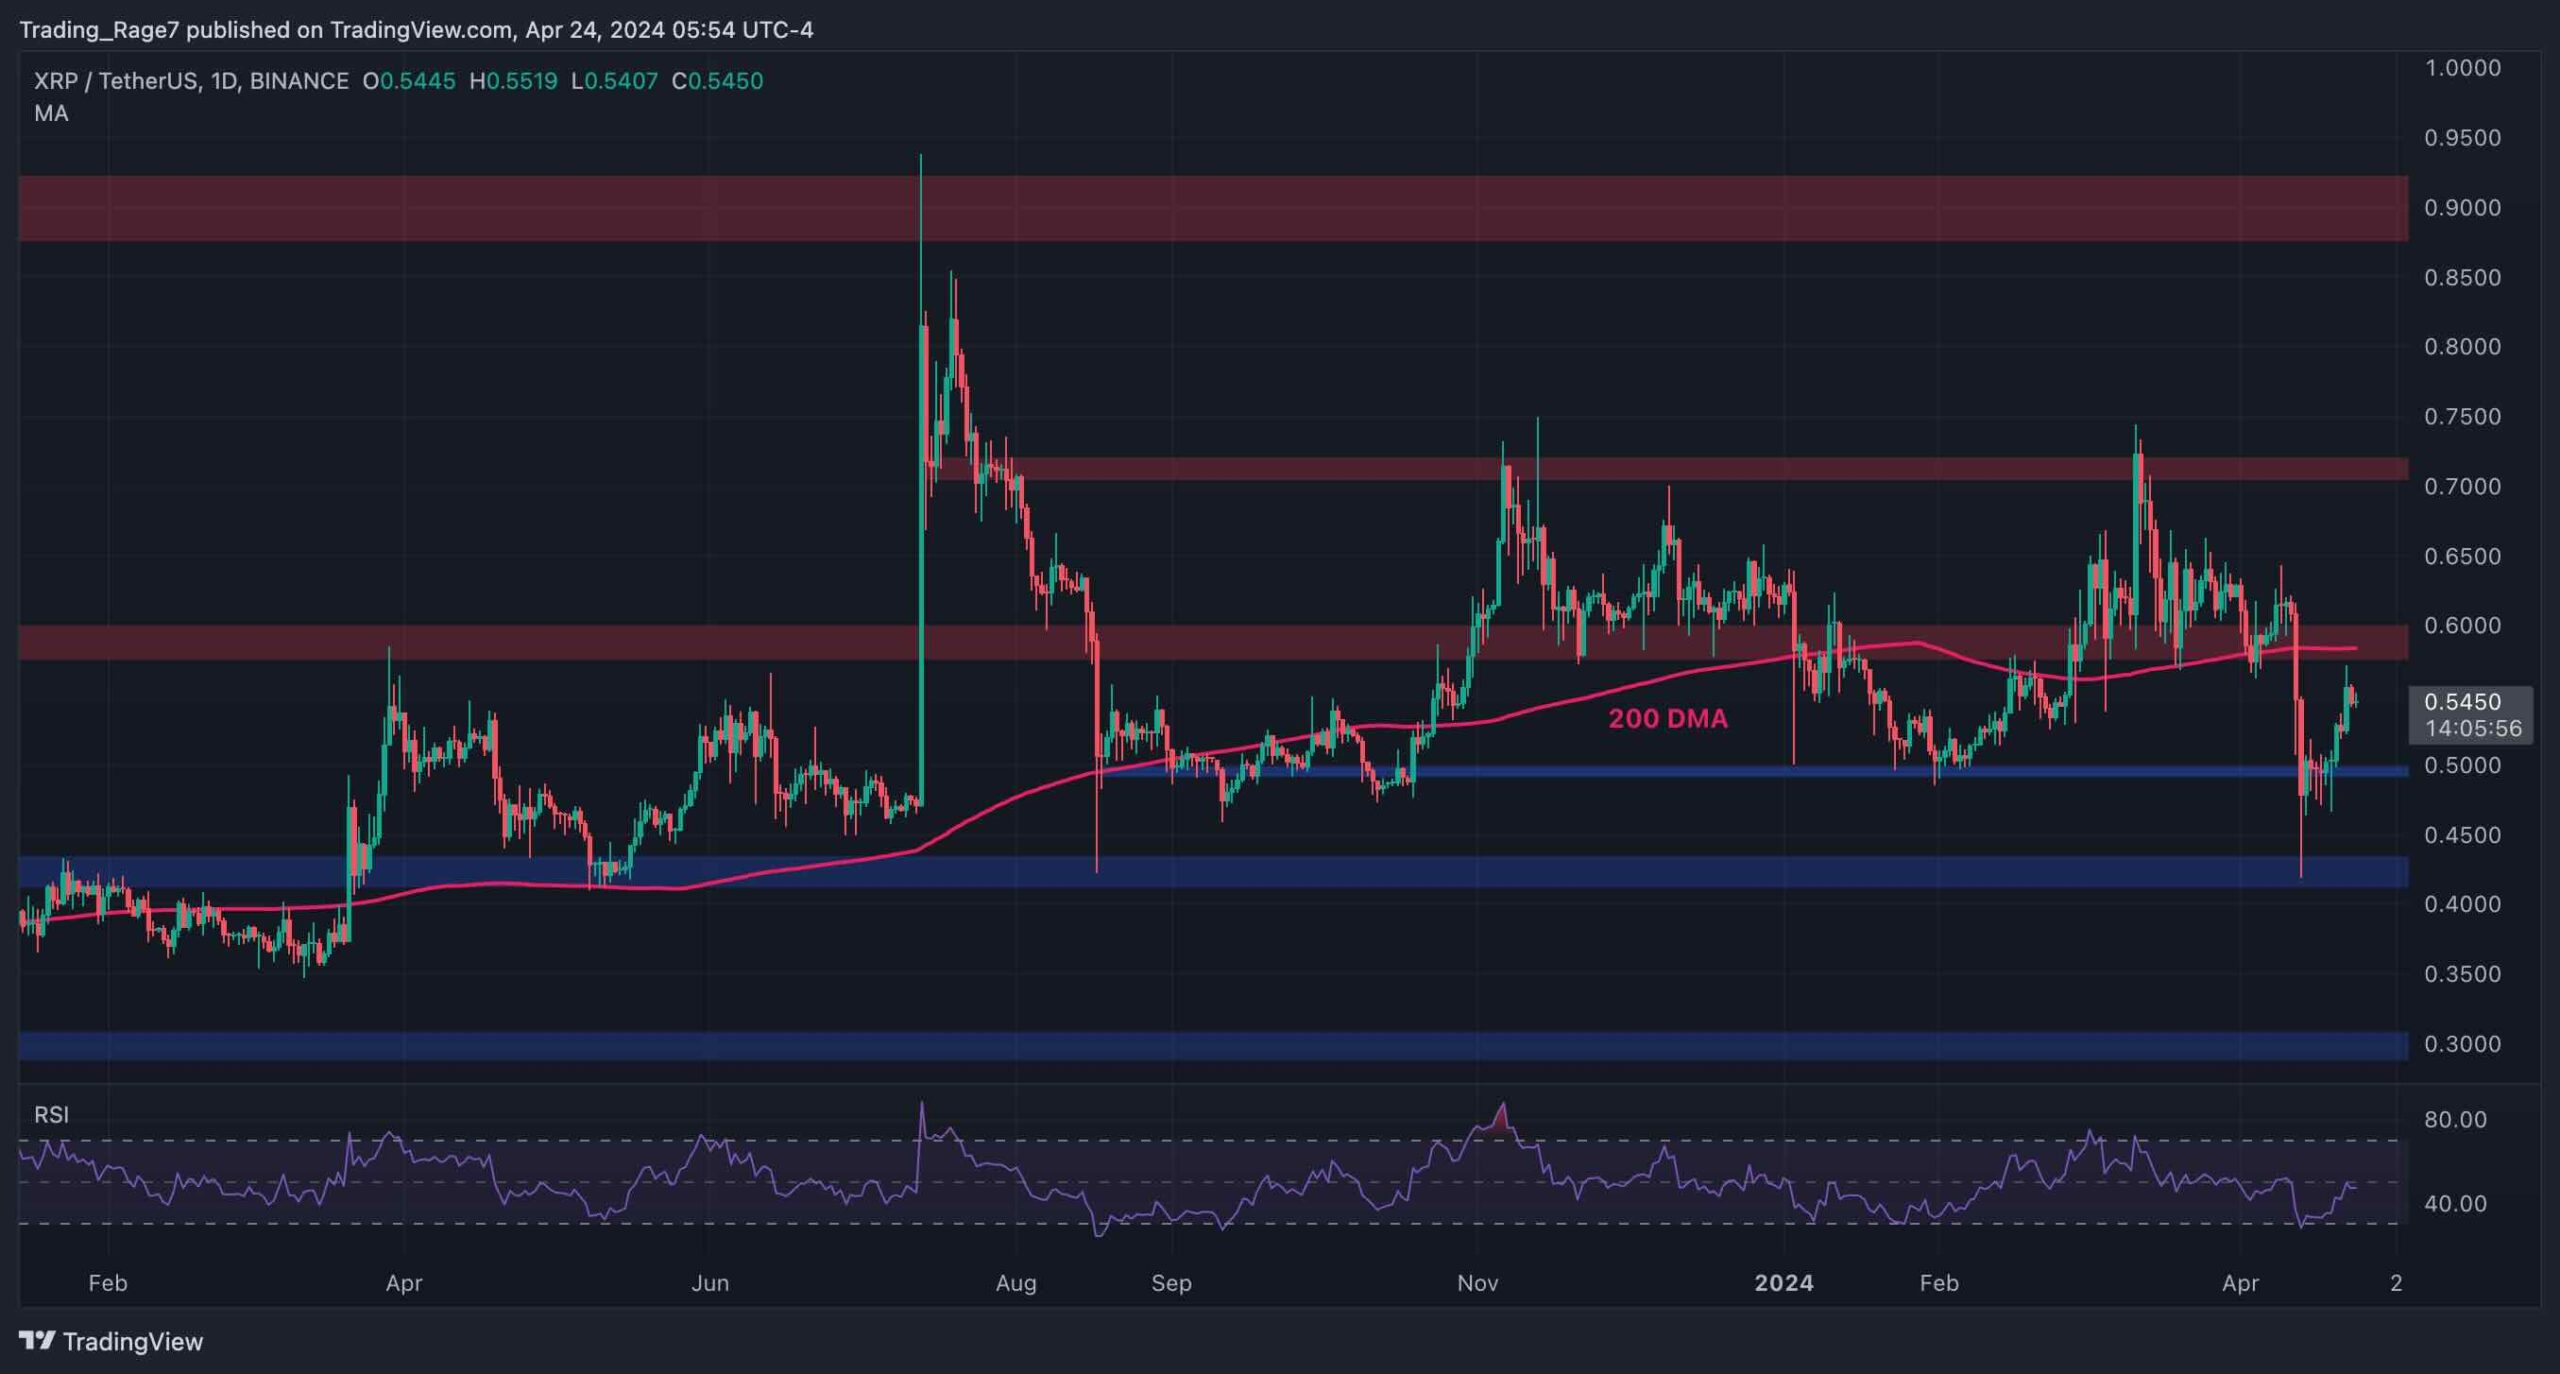
XRP took a substantial hit in terms of its price this month, with the cryptocurrency falling on the charts in early-September on the back of Bitcoin’s fall. However, the past week has illustrated a determined XRP, one with strong bullish momentum as it tried to recover its previous losses.
– Advertisement –
At press time, XRP was being traded at $0.24 with a market cap of over $11 billion. Despite the previous week’s upward momentum, the price of the coin did note a minor dip of over 1 percent over the past 24-hours, with a trading volume of $2 billion.
XRP 4-hour chart
Source: XRP/USD, TradingView
– Advertisement –
According to XRP’s 4-hour chart, the price has been moving in a steady ascending channel with a long-term breakout downwards expected in the coming week. The uptrend noticed on the daily chart may end up with a slight correction over the aforementioned period, however, dropping the price to its support at $0.241. With the price continuing to move within the formation, it is likely to briefly visit its resistance level at $0.25, following which, a downward breakout is quite possible. Further, there was an additional support at $0.23 and a resistance level at $0.27 for the coin.
At the time of writing, the MACD indicator had undergone a bearish crossover, confirming the possibility of a downward dip in the coin’s price over the coming week. Further, the RSI also echoed a similar sentiment, with the same falling towards the oversold zone on the charts.
Most altcoins in the long-term do exhibit substantial correlation with the king coin – Bitcoin, and such is the case for XRP. Over the past year, the XRP-BTC correlation has registered a significant uptick from 0.66 to 0.81.
Conclusion
XRP’s long-term price action looked slightly bearish as the coin was likely to see its price dip to its immediate support in the coming week, once it breaks out of the ascending channel formation. However, before such a move is made on the price charts, the coin may see it touch the resistance at $0.25, following which, a drop was quite likely.


