


The price of APCoin (APE) has increased by more than 30% since its all-time low of $0.99 on October 9.
During the rise the price broke the long-term descending resistance line. How long will this increase continue?
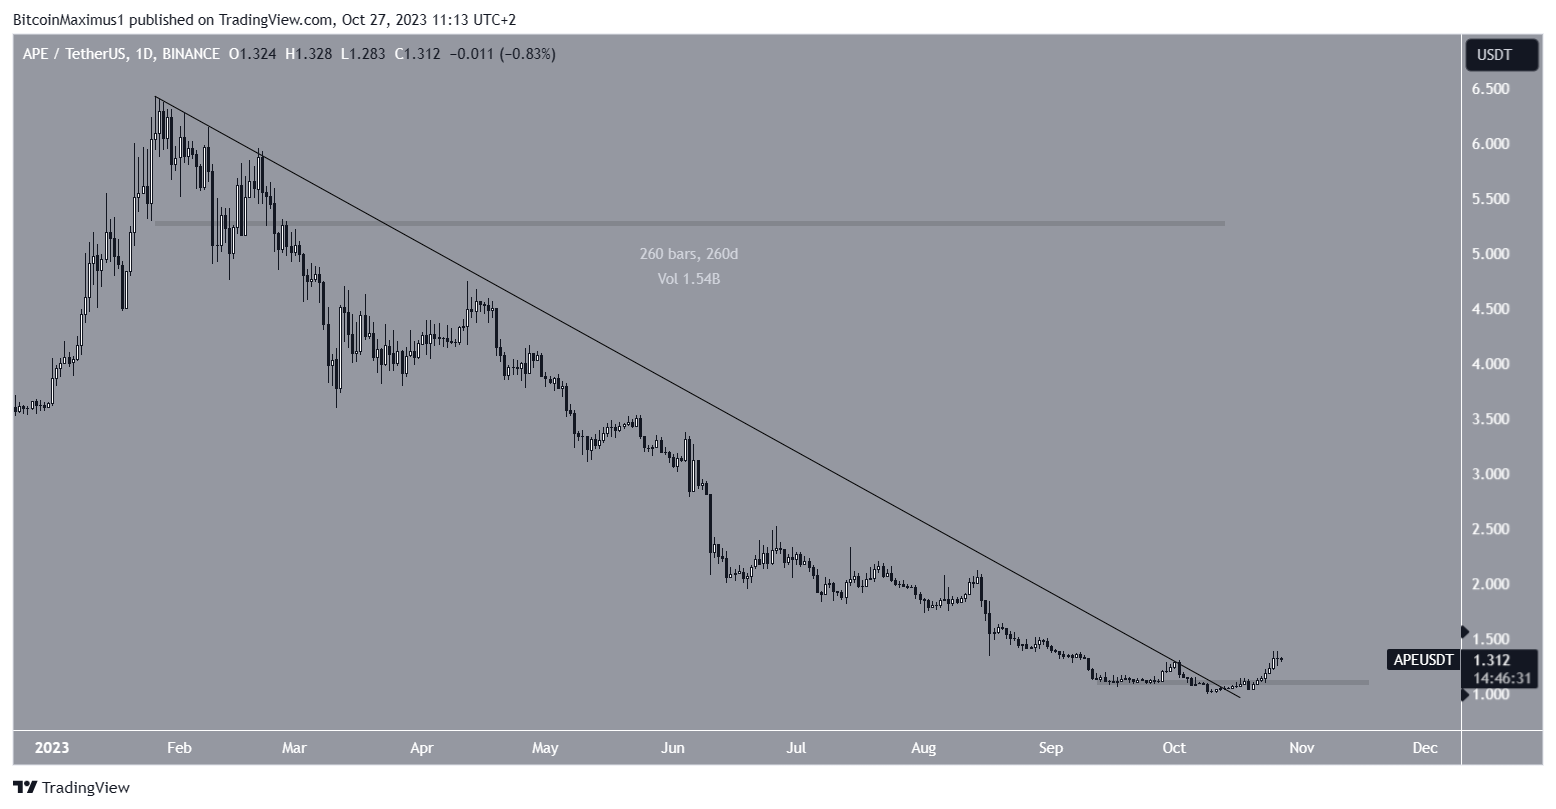
APCOIN rallies after all-time low
On October 9, the price of APE fell to a new all-time low of $1. The decline continued its decline since January, reaching a high of $6.42. The decline followed a descending resistance trend line.
Immediately after the low, APE price reversed its trend and started moving up.
Read more: Top 9 Telegram Channels for Crypto Signals in 2023
Furthermore, it reclaimed the $1.10 horizontal zone and reached a high of $1.39 on October 25. At the time of the breakout, the trendline had been in place for 260 days.
The daily Relative Strength Index (RSI) gives a bullish reading.
The RSI is a momentum indicator that traders use to evaluate whether the market is overbought or oversold and whether to accumulate or sell an asset.
A reading above 50 and an upward trend suggests that bulls still have the advantage, while a reading below 50 indicates the opposite.
The RSI is rising and above 50, both of which are considered signs of a bullish trend.
What are analysts saying?
Due to the upward move, cryptocurrency traders and analysts on X are predominantly bullish.
Sheldon_Sniper tweets belief in price breakout from APCoin’s falling resistance trend line APE may rise to $3.20. he adds:
“The 10-month downtrend is now showing a potential strong breakout that could result in big profits”
 price surges 30% from all-time low: could it target $2 next? 1")
DaanCrypto also shared a similar chart same breakout,
Traders CryptoWarrior01 and VikingXBT There is also a bullish outlook On APE.
However, his predictions are bullish due to the short-term breakout from horizontal resistance.
 price surges 30% from all-time low: could it target $2 next? 2")
Despite these bullish forecasts, APE price has fallen slightly since the tweet and is struggling with the $1.30 resistance level.
Read more: 9 Best Crypto Demo Accounts for Trading
APE Price Prediction: Will the price rise above $2?
To determine the direction of a trend, technical analysts use the Elliott Wave theory, which involves the study of recurring long-term price patterns and investor psychology.
The most probable calculation suggests that APE price began a five-wave uptrend right after its all-time low on October 11. If so, it is currently in the fourth wave of this upward move.
If the count is correct, APE will complete its correction between the 0.382-0.5 Fibonacci retracement support level at $1.22-$1.25 before completing the count at the $1.50 resistance zone.
Based on the current price, there will be an increase of 15%.
 price surges 30% from all-time low: could it target $2 next? 3")
Despite this bullish APE price prediction, a break below the first wave of $1.15 (red line) would invalidate this bullish count.
In that case, APE could decline by another 20% and reach the nearest support at $1.05.
Read more: 9 Best AI Crypto Trading Bots to Maximize Your Profits
For BeInCrypto’s latest crypto market analysis, click here.
Disclaimer
In line with Trust Project guidelines, this value analysis article is for informational purposes only and should not be considered financial or investment advice. BeInCrypto is committed to accurate, unbiased reporting, but market conditions are subject to change without notice. Always do your research and consult a professional before making any financial decisions.


