


Crystal structure and morphology of ZnO films
A 650 ± 20 nm thick ZnO piezoelectric film was grown on the Pt/Ti-coated Si and SiC substrate using the RF sputtering method. The structural properties of the synthesized ZnO film on the Pt/Ti coated oxidized Si and SiC substrates were investigated using high-resolution X-ray diffraction (HRXRD, M/s. Rigaku, Japan), and the results are shown in Fig. 1. ZnO layers deposited on Pt/Ti/SiC exhibit a stronger (0002) orientation as compared to ZnO deposited on an oxidized Si substrate with a Pt/Ti coating. The (0002) rocking curve for ZnO on SiC is depicted in the inset of Fig. 1, with a full width at half maximum (FWHM) of 2.45\(^\circ\). This outcome is consistent with the cross-sectional field-emission scanning electron microscope (SEM, M/s. Carl Zeiss, Germany) observation at 3 kV operating voltages, as shown in Fig. 2a,b. On the SiC substrate, ZnO is shown to have a much better columnar microstructure normal to the substrate surface than on the Si substrate. The surface morphology was measured using atomic force microscopy (AFM, Asylum Research, M/s. Oxford Instruments, UK) with a non-contact cantilever single-crystal silicon tip of size 10 nm in the tapping mode, and a representative result for ZnO/Pt/Ti/SiC is displayed in Fig. 2c. The ZnO films exhibit RMS surface roughness of 9.7 ± 0.3 nm and 4.9 ± 0.2 nm for ZnO/Pt/Ti/Si and ZnO/Pt/Ti/SiC, respectively.
The XRD profile of ZnO films on Pt/Ti/\(SiO_2\)/Si and Pt/Ti/SiC substrate and (inset) rocking curve of (0002) peak of ZnO film on Pt/Ti/SiC substrate.

SEM cross-sectional micrograph of ZnO film grown on (a) Pt/Ti/Si substrate, (b) Pt/Ti/SiC substrate, and (c) AFM image of ZnO film grown on Pt/Ti/SiC substrate.
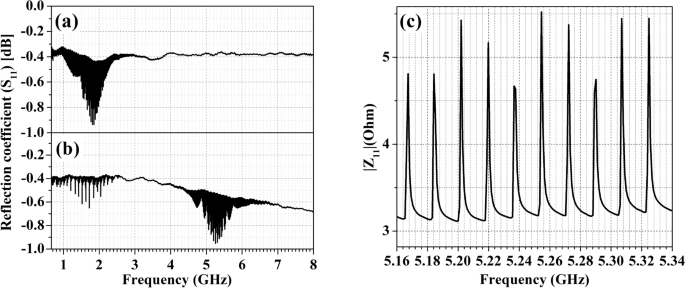
\(S_{11}\) parameter for fabricated ZnO-based HBAR device on (a) Pt/Ti/\(SiO_2\)/Si and (b) Pt/Ti/SiC substrate. (c) \(Z_{11}\) parameter for fabricated ZnO-based HBAR device on Pt/Ti/SiC substrate.
Electro-acoustic characterization
The measured reflection coefficient (\(S_{11}\)) parameter of the fabricated ZnO-based HBAR on the Si and SiC demonstrates multiple resonances over a very wide band (up to 7 GHz), as shown in Fig. 3a,b, respectively. The strongest excited resonances for the ZnO-HBAR on Si and SiC are centered at frequencies of 1.85 GHz and 5.25 GHz, respectively. ZnO has a longitudinal acoustic velocity of approximately 6400 m/s and a shear acoustic velocity of about 2770 m/s.25 The strong resonance frequency (\(f_n\)) of the HBAR can be approximated using the expression \(f_n\) = \(v_a\)/2t where \(v_a\) and t are the acoustic velocity and thickness of the piezoelectric film, respectively.4,26 In literature, it is reported that if the c-axis of ZnO film is perfectly oriented with respect to the normal of the substrate surface (Zero tilted angle), then the effective electromechanical coupling coefficient for longitudinal acoustic propagation (\(k_{L, eff}^2\)) is around 8.53\(\%\) and for shear acoustic propagation (\(k_{S, eff}^2\)) is 0\(\%\). However, if the c-axis of the ZnO is tilted at any angle with the normal of the substrate, then the \(k_{S, eff}^2\) for shear mode acoustic wave takes precedence over the \(k_{L, eff}^2\) for longitudinal mode acoustic wave.25 In this study, the c-plane of ZnO film is not highly oriented along the normal of the Si substrate, as evidenced by the XRD study and cross-sectional SEM micrographs in Figs. 1 and 2. Additionally, Si has relatively high longitudinal acoustic propagation losses (8.3 dB/cm @ 1 GHz), which are contrasted with its shear acoustic propagation losses (3.0 dB/cm @ 1 GHz) and a lower acoustic velocity than the other substrate materials.23 Hence, HBAR on a Si substrate only exhibits shear resonance. On the other hand, ZnO film is highly oriented along the (0002) direction on the SiC substrate, which is observed from the rocking curve analysis of XRD with an FWHM of 2.45\(^\circ\) and cross-sectional SEM micrograph in Fig. 2 compared to a Si substrate. Additionally, SiC is widely known for having low acoustic losses in both longitudinal and shear acoustic propagations (0.4 and 0.3 dB/cm @ 1 GHz) and a high acoustic velocity when compared to Si substrates.23 Therefore, the ZnO-based HBAR mounted to a SiC substrate demonstrates both shear and longitudinal resonance.
Figure 3c represents the measured impedance, or \(Z_{11}\) parameter, of the HBAR close to the strongest excited resonances on the SiC. The frequency range between each narrow resonance depends on the thickness (\(t_s\)) of the substrate since the acoustic energy from the piezoelectric layer is coupled to it. This frequency spacing (\(\Delta\) \(f_{overtone}\)) between narrow resonances is determined as \(\Delta\) \(f_{overtone}\) = \(v_s\)/2\(t_s\), where \(v_s\) is the acoustic velocity of the substrate.4 The computed acoustic velocity from the equation is often a few percent lower than the real acoustic velocity because this expression is produced by ignoring the action of the piezoelectric layer on the substrate. The equation below describes the discrepancy between the calculated and actual acoustic velocities.4


$$\begin{aligned} v_{actual} – v_{calc} = v_{calc} \frac{\rho _p l_p}{\rho _s l_s} \end{aligned}$$
(1)
where the mass density and thickness of the substrate are represented by \(\rho _s\) and \(l_s\), respectively, and those of the piezoelectric film are represented by \(\rho _p\) and \(l_p\). The measured \(\Delta\) \(f_{overtone}\) is around 12.9 and 17.8 MHz for the HBAR on the Si (thickness 250 ± 5 \(\,{\upmu }\textrm{m}\)) and SiC (thickness 350 ± 5 \({\upmu }\textrm{m}\)), respectively. After the acoustic velocity has been rectified using the aforementioned equation, the corrected acoustic velocities of the Si and SiC substrates are esteemed to be 6490 and 12500 m/sec, respectively. The acoustic velocity for the Si substrate is measured to be greater than the shear acoustic velocity value, despite the fact that it is remarkably equivalent to the reported longitudinal acoustic velocity value for the SiC substrate.23,27 This multitude of modes offers a special opportunity to use the HBAR as a biofluid sensor.

(a) The measured and mBVD fitted \(S_{11}\) parameter and phase (inset) of ZnO-based HBAR resonator on SiC substrate at 5.25 GHz resonance, (b) The equivalent circuit diagram of mBVD model.
To comprehend the detailed behavior of device parameters, a modified Butterworth-Van Dyke (mBVD) model has been designed using Advance Design System (ADS, Keysight) software. Figure 4a depicts a typically measured and mBVD fitted \(S_{11}\) parameter for ZnO-based HBAR on a SiC substrate at 5.25 GHz resonance. The mBVD model comprises circuit parameters such as motional resistance (\(R_m\)), motional capacitance (\(C_m\)), motional inductance (\(L_m\)), and static capacitance (\(C_0\)), resistance (\(R_0\)), which is shown as an equivalent circuit in Fig. 4b. From the equivalent circuit, the \(f_r\) is the resonance frequency where the series resonance occurs, \(f_a\) is the anti-resonance frequency where the parallel resonance occurs, and the effective electromechanical coupling coefficient (\(k_{eff}^2\)) is given by the below equations.
$$\begin{aligned} f_r= & {} \frac{1}{2\pi \sqrt{L_m C_m}} ~~~ and ~~~ f_a = \frac{1}{2\pi \sqrt{L_m(C_m^{-1}+C_0^{-1})^{-1}}} \end{aligned}$$
(2)
$$\begin{aligned} k_{eff}^2= & {} \frac{\pi ^2}{4}. \frac{f_r}{f_a}. \left[ 1 – \frac{f_r}{f_a} \right] \end{aligned}$$
(3)
The quality factor of the HBAR device on SiC substrate at the strongest excited resonance is measured using the new Q approach based on \(S_{11}\) parameter proposed by Feld et al. and it is related as follows;28,29

$$\begin{aligned} Q = \omega . \bigg |\frac{dS_{11}}{d\omega }\bigg |. \frac{1}{1 – |S_{11}|^2} \end{aligned}$$
(4)
The electromechanical characteristics extracted from the mBVD model and the Q-factor of HBAR on Si and SiC substrates at the strongest excited resonances using the new Q approach are listed in Table 1. The product of resonance frequency and the measured quality factor (f.Q products) are then determined for the HBAR devices. We observed that the resonators for Si and SiC substrates, respectively, exhibit an f.Q product of 0.06 \(\times\) 10\(^{13}\) and 4.1 \(\times\) 10\(^{13}\) Hz. Pang et al., Baumgartel et al. and Zhang et al. has reported that the f.Q product of ZnO-based HBAR on Sapphire are 0.9 \(\times\) 10\(^{13}\), 4.5 \(\times\) 10\(^{13}\) and 4.8 \(\times\) 10\(^{13}\), respectively, using Lakin’s Q method (Table 2).4,20,21 Here, we have also estimated the f.Q value using Lakin’s Q method for HBAR devices on SiC, and reveals as 6.5 \(\times\) 10\(^{13}\) Hz, which, to the best of our knowledge stands out as the best among them. Using the novel Q approach developed by Feld et al., the f.Q product of ZnO-based HBAR on Diamond is reported by Gosavi et al. as 0.3 \(\times\) 10\(^{13}\), which is substantially lower than this finding22 .


