Bitcoin (BTC) is trading inside a range between $31,300 and $40,550.
Ethereum (ETH) has completed a leading diagonal pattern.
XRP (XRP) and Augur (REP) have broken out from descending resistance lines.
Monero (XMR) is trading inside a descending triangle.
Cocos-BCX (COCOS) is in the process of breaking out from a descending resistance line.
Solana (SOL) is trading inside a symmetrical triangle.
Bitcoin (BTC)
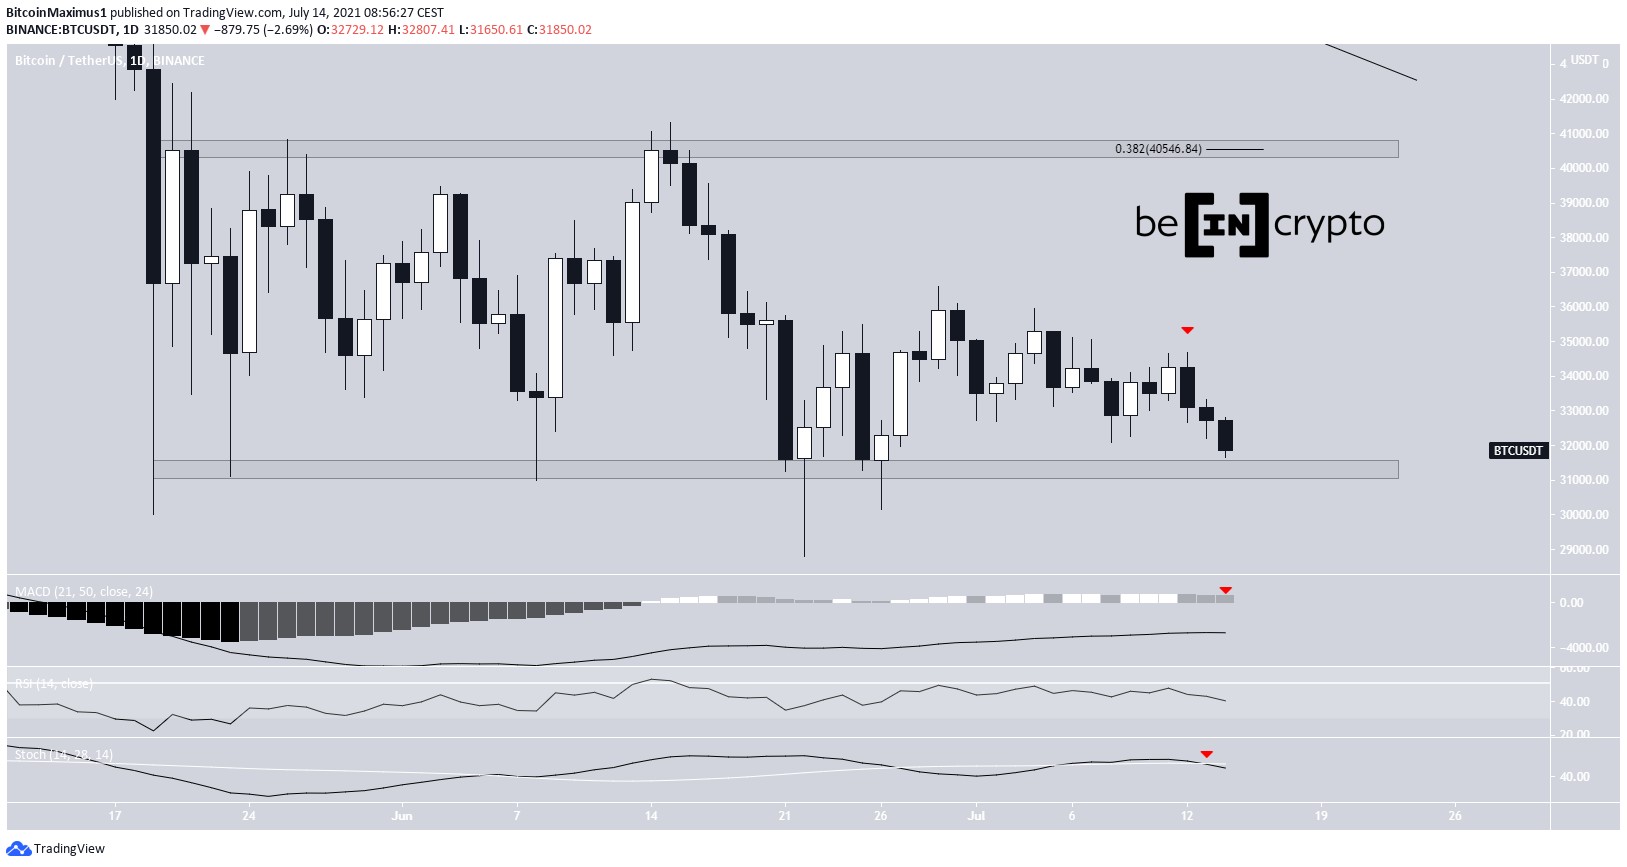
BTC has been trading in a range between $31,300 and $40,550 since May 19.
It has been moving downwards since June 12. On June 14, it managed to reach a low of $31,663, very close to the support of the range.
The ongoing decrease has caused technical indicators to turn bearish. The MACD has given a bearish reversal signal and the Stochastic oscillator has made a bearish cross (red icon). Furthermore, the RSI is below 50.
However, BTC is trading at a confluence of short-term support levels that could initiate a bounce.
Ethereum (ETH)
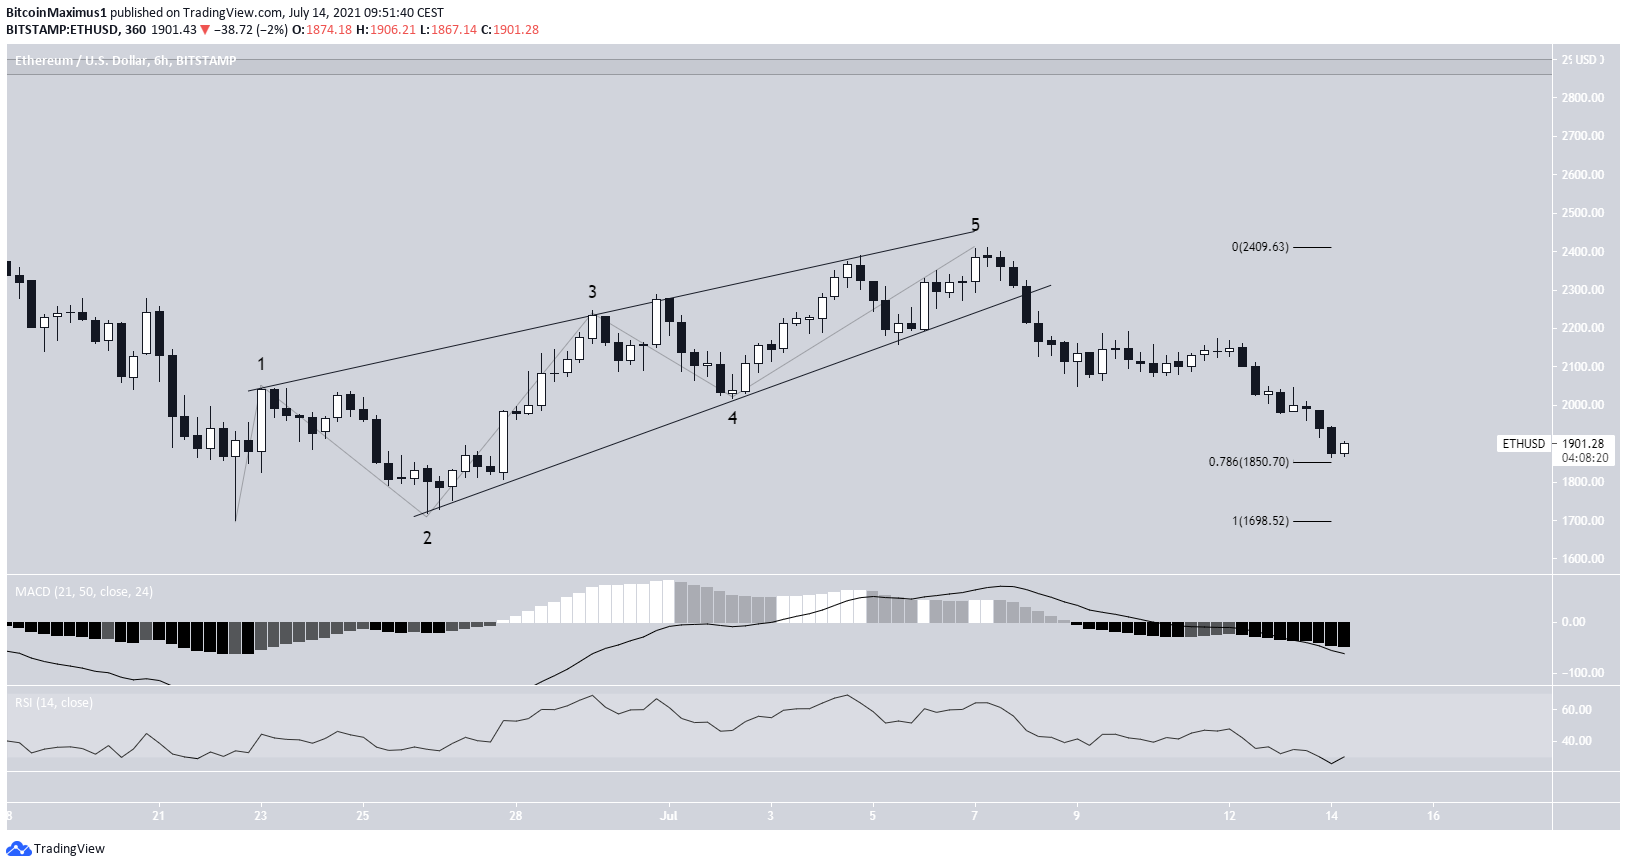
ETH has been decreasing since July 7 after it reached a high of $2,361. The downward move caused it to break down from an ascending wedge.
So far, ETH has reached a low of $1,865. The low was made very close to the 0.786 Fib retracement support level of $1,850.
Indicators do not show any clear bullish reversal signs yet, despite the the RSI having just fallen into oversold territory.
The upward move looks like a completed leading diagonal. Therefore, it’s possibe that ETH soon move toward the $2,880 horizontal resistance area.

XRP (XRP)
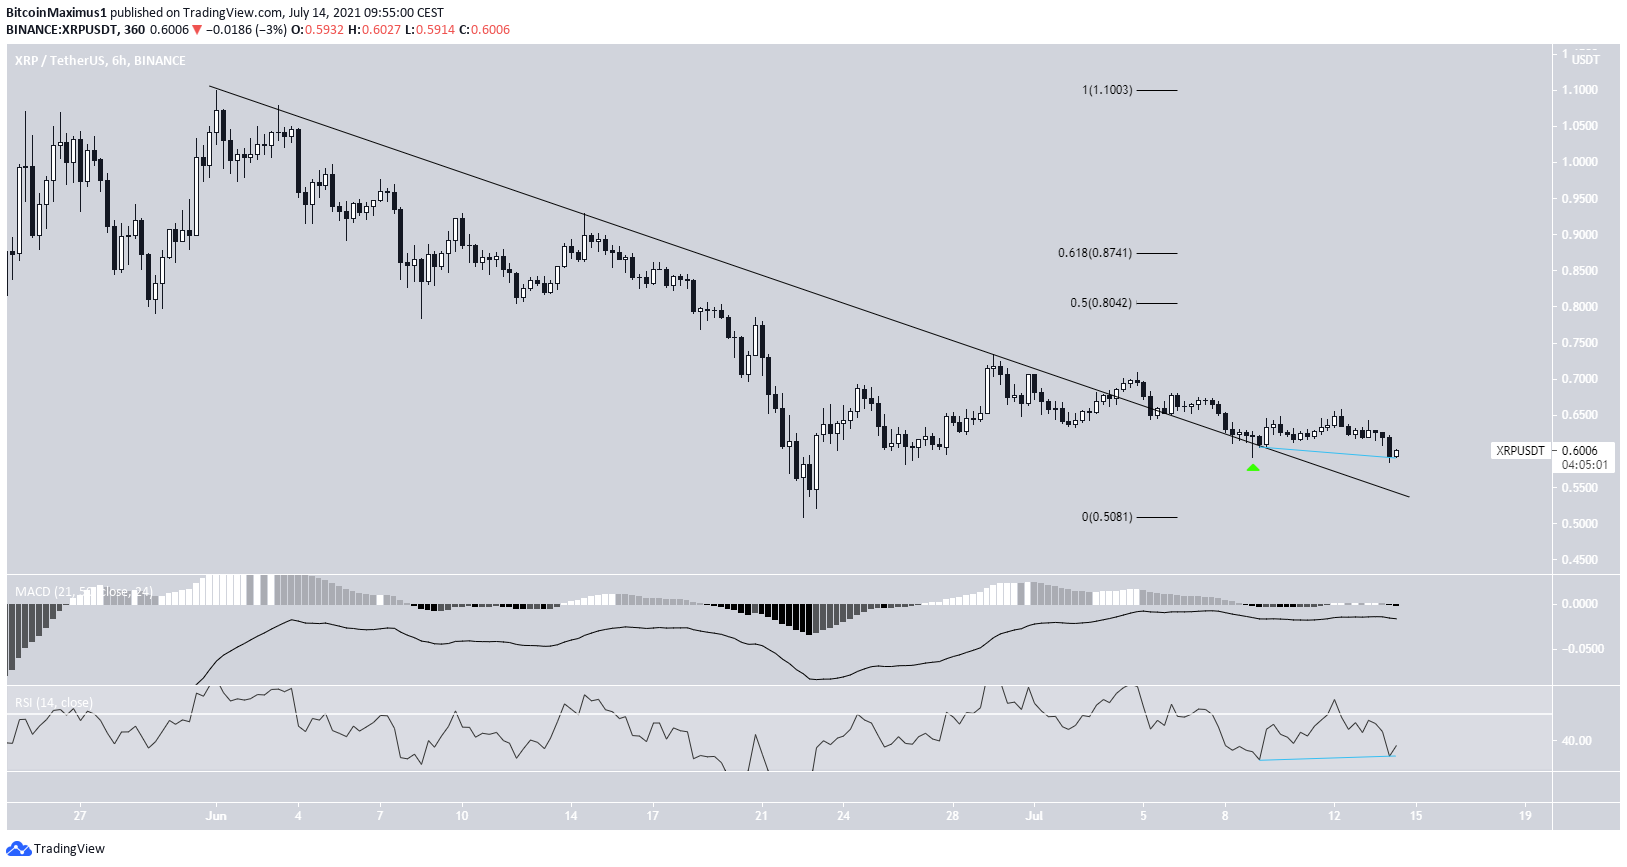
On June 1, XRP began decreasing alongside a descending resistance line. After four unsuccessful attempts, it finally managed to break out on July 4.
Following the breakout, it returned to the line and validated it as support (green icon).
While it has yet to initiate a significant upward move, there is a bullish divergence in place in the RSI.
The next closest resistances level would be found at $0.80-$0.87. These targets are the 0.5-0.618 Fib retracement resistance levels.
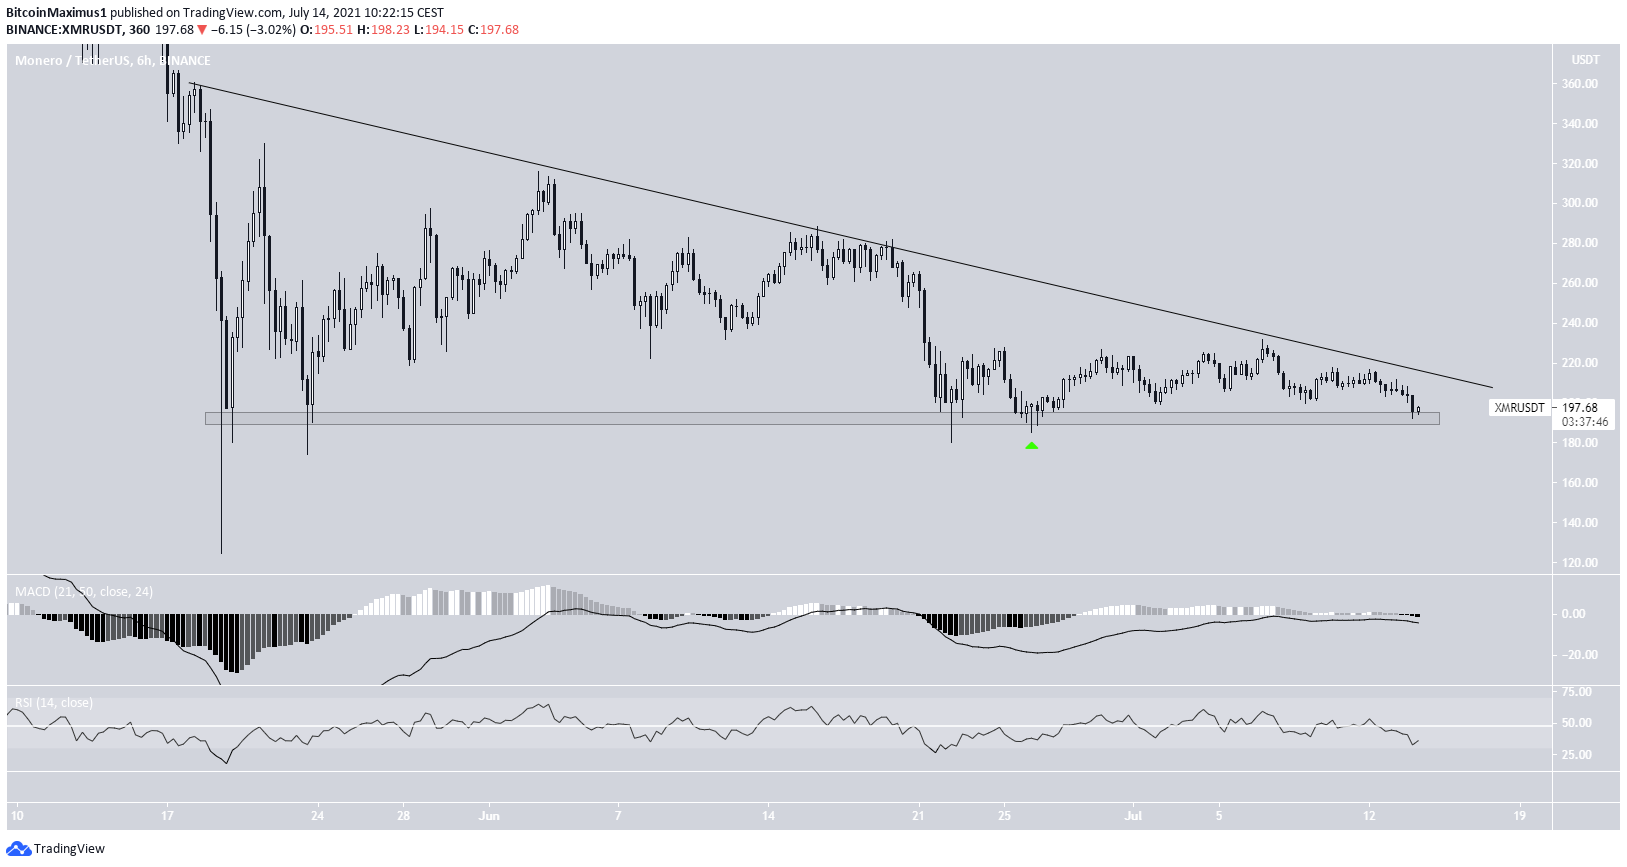
XMR
XMR has been following a descending resistance line since May 18. So far, it has touched the line four times, most recently on July 6.
The main support area is found at $190. It bounced from this suport on June 26 (green icon), and has been increasing since.
However, when combined with the descending resistance line, this support forms a descending triangle. This formation is often considered a bearish pattern.
Technical indicators are neutral. The MACD is at the 0-line while the RSI is moving freely above and below the 50-line.
Whether XMR closes below this area or breaks out above the resistance line will likely determine the direction of the longer term trend.
REP
REP had been following a descending resistance line since May 20. It managed to break out on July 6 and validated the line as support two days later (green icon).
On July 14, it initiated a significant upward move and has increased by 32% so far.
Technical indicators are bullish and support the continuation of the upward move. This is especially evident by the RSI cross above 50.
The main resistance area is found at $26.34. This is the 0.382 Fib retracement resistance level.

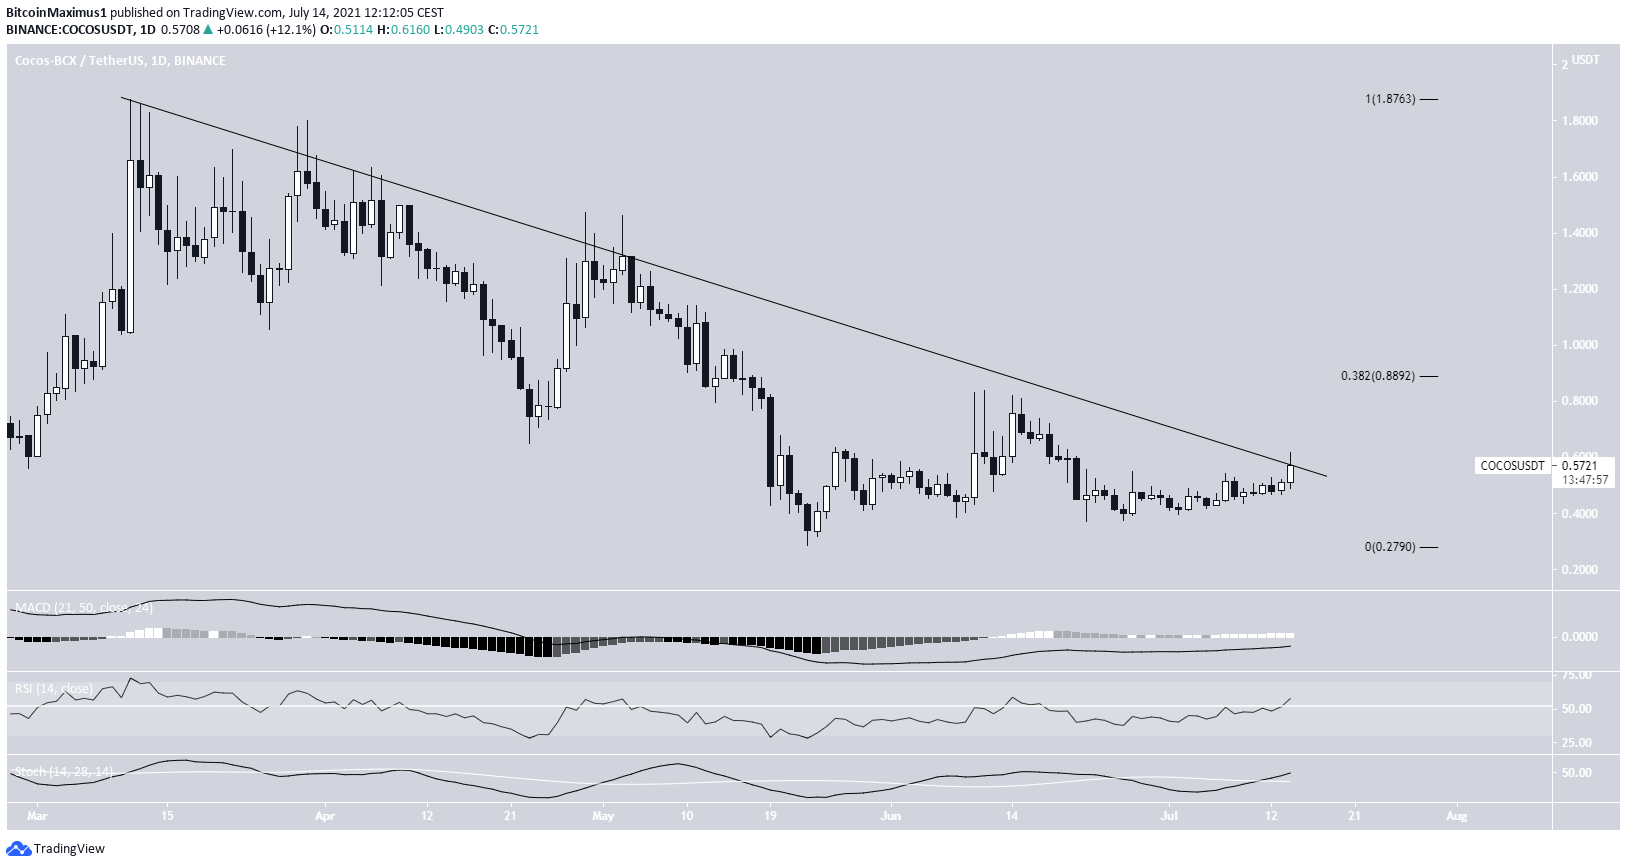
COCOS
COCOS has been moving downwards underneath a descending resistance line since March 11, after it had reached a high of $1.87. It hit a low of $0.285 on May 23. COCOS has been moving upwards since then and created a higher low on June 22.
Currently, it’s making an attempt at breaking out above the aforementioned descending resistance line. Technical indicators are bullish, supporting the possibility that COCOS will be successful in doing so.
The next resistance level is found at $0.89 (the 0.382 Fib retracement resistance area).
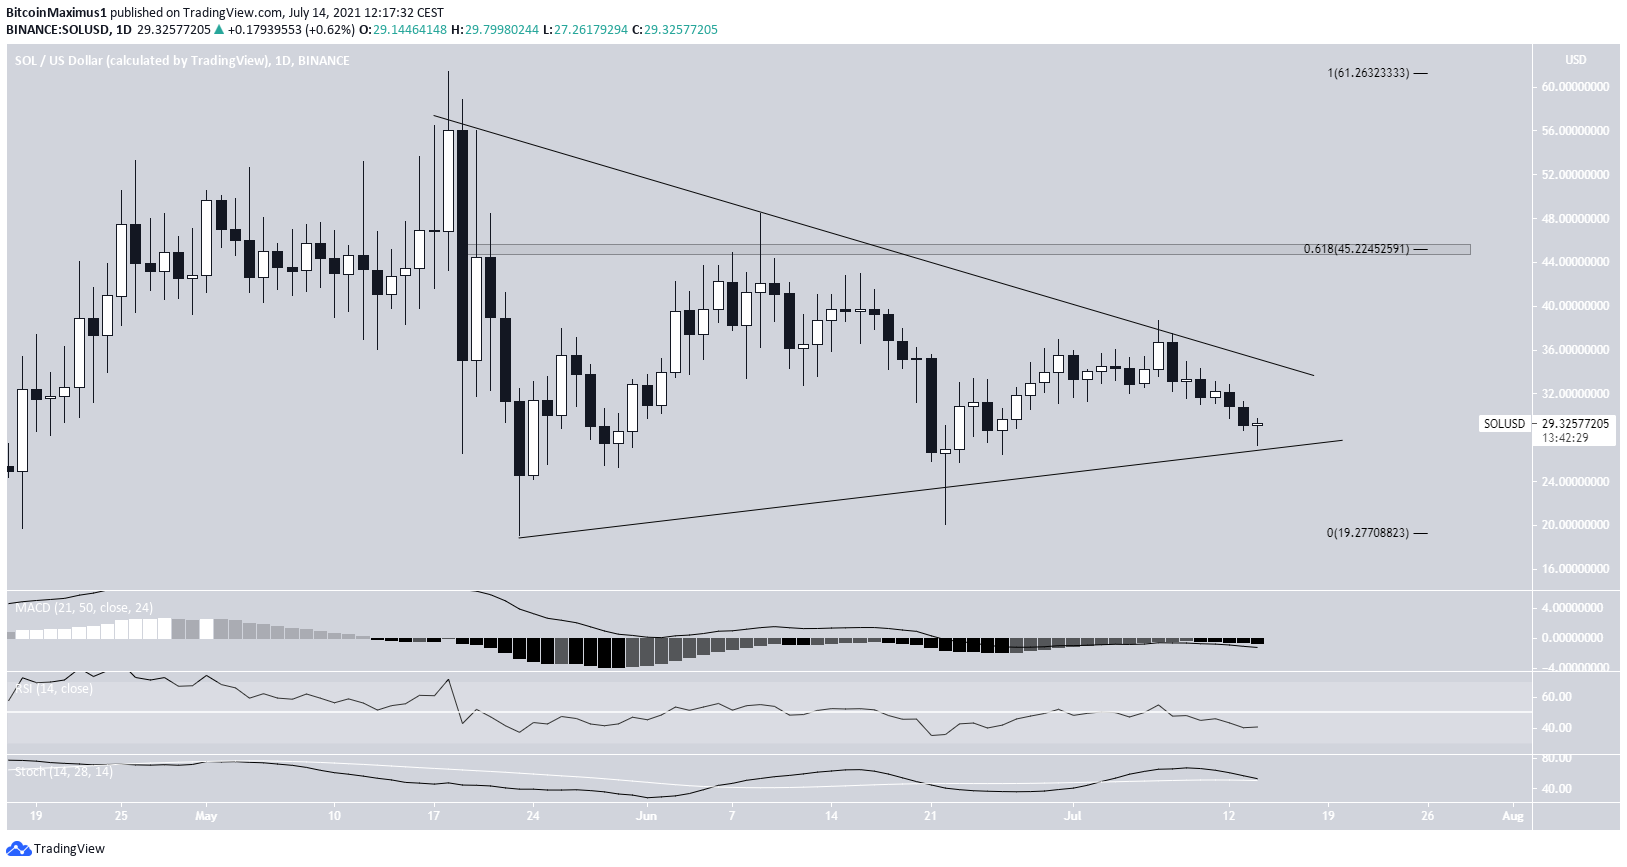
SOL
SOL has been trading inside a symmetrical triangle since May 18. So far, both the support and resistance lines have been validated multiple times. Most recently, SOL bounced at the support area on July 14.
Technical indicators are relatively neutral.
However, the triangle is transpiring after an upward movement, therefore a breakout would be likely.
If it does, the closest resistance would be found at $45.20. This is the 0.618 Fib retracement resistance area.
For BeInCrypto’s latest bitcoin (BTC) analysis, click here.
Disclaimer
All the information contained on our website is published in good faith and for general information purposes only. Any action the reader takes upon the information found on our website is strictly at their own risk.