Keystone/Hulton Archive via Getty Images
I am assigning Coinbase Global, Inc. (NASDAQ: NASDAQ:COIN) a neutral risk/reward rating. This is based on its valuation collapse and foundational role in the global crypto markets being offset by the unquantifiable risks emanating from shadow banking leverage and interdependencies at the heart of the global crypto economy. My previous two Coinbase reports in August and September of 2021 featured negative risk/reward ratings.
Risk/Reward Rating: Neutral
Coinbase reported a surprise loss for Q1 2022 after the market closed on May 10, 2022, sending the shares down 25% to $55 as I write this report. Interestingly, the company left its previous guidance for 2022 (provided on February 24, 2022) largely unchanged. While there are several moving parts to the profitability collapse, one in particular stands out as a red flag.


Key Business Metrics
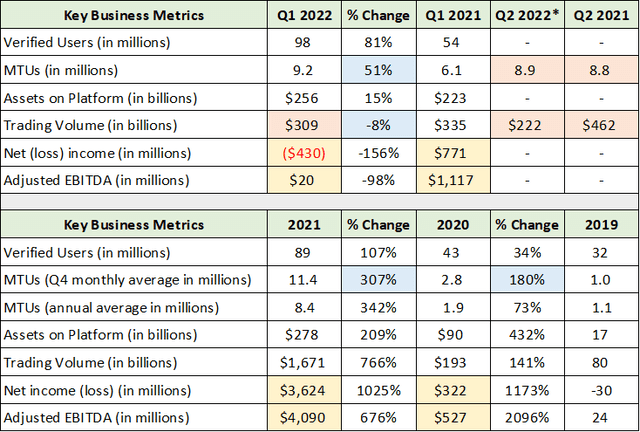
The red flag can be found in reviewing Coinbase’s Key Business Metrics in conjunction with its transaction revenue details, which I have summarized in the following two tables. They were compiled from Coinbase’s Q1 2022 8-K, Q1 2022 10-Q, and 2021 10-K filed with the SEC. I have color-coded the comparable cells for ease of reference.
Please note that MTUs stands for Monthly Transacting Users. This metric represents retail users who have engaged in some sort of transaction on the Coinbase platform during the period. Verified Users represent the total number of accounts on Coinbase for which a functioning email address or phone number was provided. As a result, Verified Users have not necessarily had their identities verified. Additionally, users can set up an unlimited number of accounts on Coinbase, leaving the MTUs and Verified Users as high-end estimates of Coinbase’s active customer and prospect base, respectively.
Created by Brian Kapp, stoxdox
The first hint of trouble can be found in the blue highlighted cells. Notice that MTUs were up an impressive 51% in Q1 2022 compared to Q1 2021, while trading volumes declined by -8% over the same period. This suggests that Coinbase’s active customers, or MTUs, are becoming lower quality from a revenue generation perspective. Additionally, the 51% growth rate in Q1 represents a massive deceleration from 307% and 180% growth for the full years of 2021 and 2020.
I have highlighted in yellow Coinbase’s profitability metrics. The collapse in Q1 2022 to a loss of -$430 million and roughly breakeven adjusted EBITDA is incredible when compared to a profit of $771 million and $1.1 billion of adjusted EBITDA in Q1 2021. This collapse becomes more worrisome when viewing the orange highlighted cells.
Please note that the Q2 2022* column displays Coinbase’s activity through April of 2022, which I have transformed into a Q2 2022 run rate (I multiplied April’s transaction volume by 3). Importantly, April of 2022 suggests a quarterly transaction volume run rate of less than half that of Q2 2021, and roughly two-thirds of the Q1 2022 volume. The next table completes the picture for the primary red flag.
Transaction Revenue Details
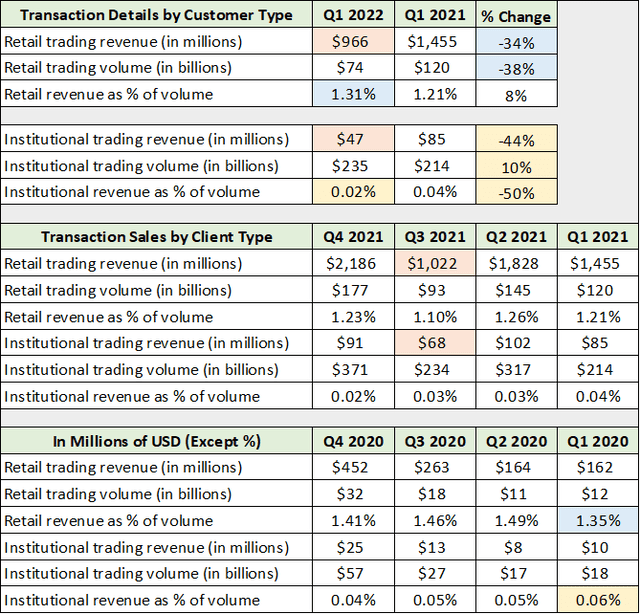
Given that active users were up 51% year-over-year in Q1 2022 and transaction volumes declined -8%, the red flag surrounds the type of user engagement on the Coinbase platform. The following table was compiled from the same SEC documents used above as well as my September 2021 Coinbase report. I have once again color coded the comparable cells for ease of reference.
Created by Brian Kapp, stoxdox
I have highlighted in blue the key retail transaction details. The -34% plunge in retail transaction revenue and the -38% collapse in retail trading volume in the face of 51% user growth illuminates the red flag. What is fascinating is that institutional trading volume expanded by 10% while institutional transaction revenue plummeted by -44% (highlighted in yellow). Notice that the institutional fee rate fell by 50% to .02%. I have highlighted in orange the fact that Q1 2022 transaction revenues have taken out the prior lows established in Q3 2021. The following quote from the Risk Factors in Coinbase’s 2021 10-K provides additional color (emphasis added).
A relatively small number of institutional market makers and high-transaction volume retail customers account for a significant amount of the Trading Volume on our platform and our net revenue.
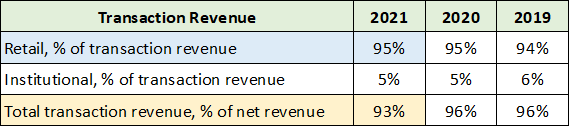
The above quote brings to light an underlying dynamic on the Coinbase platform, which is a concentration of transaction volume. While details are sparse, there are a small number of institutional market makers that enable the retail transactions on Coinbase’s platform. It is also likely that a small number of high-volume retail customers serve a similar role. This is important because retail transaction volumes account for nearly all of Coinbase’s revenue, as can be seen in the following table compiled from the same SEC filings.
Created by Brian Kapp, stoxdox
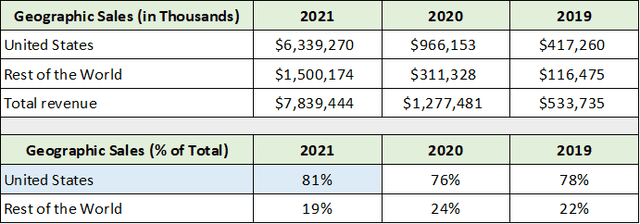
With retail customers accounting for 95% of Coinbase’s transaction revenue (which itself accounts for 93% of total net revenue), it is fair to say that Coinbase is in the business of moving cryptocurrency to retail customers and that this is enabled by a small group of institutional market makers. The concentration of the market makers likely creates a heightened degree of systemic risk on the Coinbase platform. The following table was compiled from the same SEC filings and displays the location of Coinbase’s retail customers.
Created by Brian Kapp, stoxdox
In summary, Coinbase is in the business of moving crypto to retail investors, 81% of whom are located in the United States. The red flag emanating from the collapse of retail transaction revenue alongside a still rapidly growing user base, suggests a fundamental shift is afoot in the Coinbase user base.
Retail User Trends
To better understand the trends in Coinbase’s retail user base, I have compiled key quarterly data points going back to the prior crypto peak in Q1 2018. The table below was compiled from the same SEC filings and my prior Coinbase report. The comparable cells are once again color coded for ease of comparison.
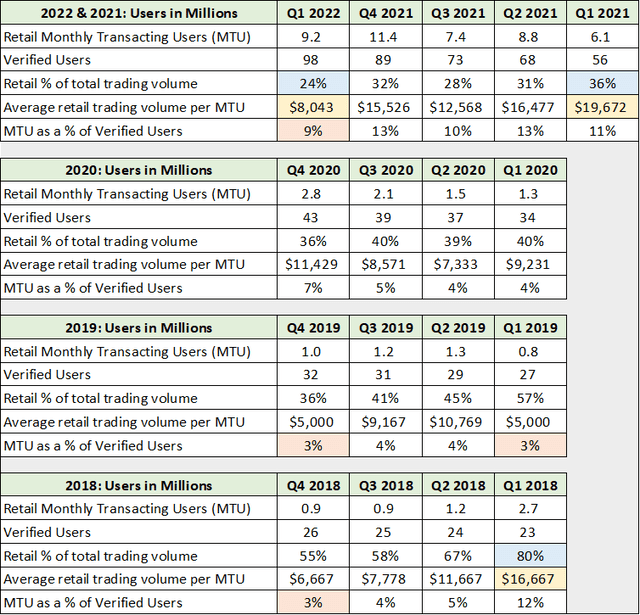
Created by Brian Kapp, stoxdox
I have highlighted the average trading volume per Monthly Transacting User in yellow. Notice that this figure peaked in Q1 2021 at $19,672 compared to the prior peak of $16,667 in Q1 2018. Given the explosion higher in crypto prices between Q1 2018 and Q1 2021, this average trading value appears to be exceptionally low as of Q1 2021. The collapse in Q1 2022 to $8,043 places Coinbase back to the depths of Q3 2018. Following the Q3 2018 collapse, average trading volumes did not recover until Q4 2020. Additionally, the recovery in Q4 2020 required the most speculative market environment since the dot-com bubble to gain lift.
Importantly, highlighted in blue, retail trading volumes have collapsed since Q1 2018, from 80% of the volume on the Coinbase platform to just 24% in Q1 2022, a new all-time low. This highlights the transition of the Coinbase platform from a largely early adopter, retail-dominated platform to an institutional, distribution-dominated platform.
The orange highlighted cells display the percentage of Verified Users that are Monthly Transaction Users in each period. Notice that this figure bottomed at 3% during the prior crypto bear market. This provides a reference point for estimating MTUs going forward. For example, Coinbase is guiding for MTUs to be in the 5 to 15 million range in 2022. If the past downturn is indicative of the platform’s user dynamics, applying 3% to the current 98 million Verified Users, MTUs may reach a low of 2.94 million in 2022. This is fully 41% beneath the low end of the company’s guidance.
Consensus Estimates
Prior to Coinbase’s earnings report last night, consensus estimates looked much too high in light of the company’s guidance provided on February 24, 2022. As I began working on this report prior to yesterday’s earnings release, I have updated consensus estimates as of this morning, May 11, 2022. The following table compiled from Seeking Alpha displays consensus earnings estimates as of three dates to highlight the rapid downshift in growth expectations. The consensus estimate dates are in the upper left-hand corner of each section. I have highlighted the 2022 estimates in blue and the 2023 estimates in yellow for ease of comparison.
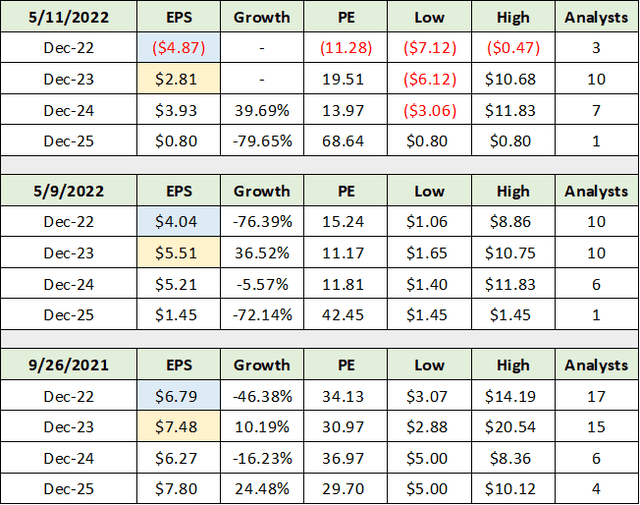
Source: Seeking Alpha. Created by Brian Kapp, stoxdox
Prior to the Q1 2022 earnings release, based on management’s February 2022 guidance, I estimated that earnings would be in a range of -$11.87 to +$5.83 (based on the low to high MTUs guidance of 5 to 15 million). Consensus estimates were at +$4.04 per share for 2022 prior to last night’s earnings release, which suggested to me that the market was projecting MTUs to be in the area of 13.5 million. This is near the top end of management’s guidance of 15 million.

As noted above, if past platform user dynamics hold and MTUs bottom at 3% of Verified Users, Coinbase could be on track to hit a low of 2.94 million MTUs in 2022. The current consensus estimate of -$4.87 per share for 2022 appears to roughly extrapolate the Q1 2022 and April 2022 user levels near 8.9 to 9.2 million MTUs through year end, roughly speaking.
As a result, there remains material downside risk to estimates if crypto prices continue in a bear market trend. The following table compiled from Seeking Alpha displays consensus sales estimates for the two most recent dates in order to place the earnings estimates in context. I have highlighted the 2022 estimates in blue and the 2023 estimates in yellow for ease of comparison.
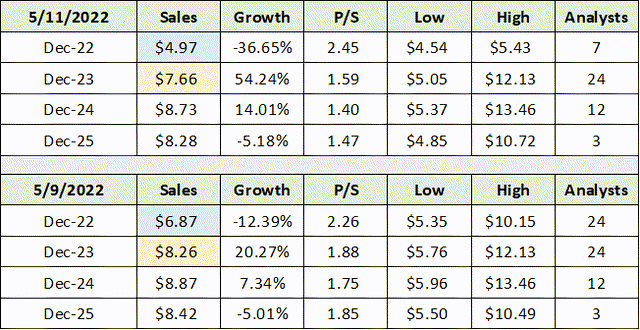
Source: Seeking Alpha. Created by Brian Kapp, stoxdox
While the 2022 consensus sales estimate has come down 28% after the earnings report, estimates for 2023 through 2025 are largely unchanged. This is in distinct contrast to the consensus earnings estimates above which were slashed for the entire period from 2022 through 2025. Analysts are clearly factoring in materially lower profit margins against roughly the same sales estimates from 2023 to 2025. If MTUs behave in line with history, by reaching 3% of Verified Users and remain there for several years, consensus sales estimates are materially too high for 2023 and 2024.
In summary, while consensus earnings estimates have quickly ratcheted lower, there remains considerable downside risk to estimates. One of the primary reasons for my negative risk/reward rating in the prior two reports was the likelihood that crypto prices and trading volumes would enter a cyclical downturn. This would then quickly reverse Coinbase’s outsized operating profitability in 2021 ($3 billion in total). Now that this risk has materialized, the question turns to whether the collapse of Coinbase’s valuation now fully accounts for the risks or whether this is just the beginning.
Risk Factors
Interestingly, Coinbase added new Risk Factor language to its Q1 2022 10-Q filed with the SEC. Risk Factors are in all annual and quarterly reports filed with the SEC and are mostly boiler plate type language. As a result, when material changes are made, it is worthwhile to take notice. The following quote is a portion of the larger passage added to Coinbase’s Risk Factors.
…in the event of a bankruptcy, the crypto assets we hold in custody on behalf of our customers could be subject to bankruptcy proceedings and such customers could be treated as our general unsecured creditors.
In essence, Coinbase is warning that the crypto assets it holds for customers may take the form of many traditional financial deposits in the event of Coinbase’s failure. The difference compared to traditional financial firms is that Coinbase’s customers do not have FDIC or SIPC-type insurance coverage to protect their assets in the event of failure.
While Coinbase itself has a strong balance sheet as we will see, this is likely not the case for the majority of the global crypto ecosystem. This is critical because Coinbase is a structural member of the global crypto market foundation. For example, Coinbase has invested in, funded, and supports over 300 industry participants with whom Coinbase is interdependent for the smooth functioning of the global crypto markets. The following quote from the above Risk Factors illuminates what is at stake.
In addition, we are dependent on our partners’ operations, liquidity, and financial condition for the proper maintenance, use, and safekeeping of these customer assets.
In essence, participants in the crypto markets are mutually dependent on one another for survival. While interdependencies are a reality for all commercial enterprises, there is one important difference. The difference in the case of Coinbase and for financial firms generally is that leverage is at the heart of the industries. As a result, the interdependencies are on the funding side in addition to the commercial side. The funding and collateral interdependencies can cause cascading failures as was seen in 2008 with Bear Stearns, AIG, Lehman Brothers, etc.
Finally, Coinbase added two risks to the sentence preceding the new Risk Factor language discussed above: the risk of litigation and regulatory enforcement actions. While these are general risks for most companies, the decision to add them specifically to the Risk Factors section discussed above is notable. All told, Coinbase’s systemic risk exposure to the leverage in the global crypto market is vast and unquantifiable, as is its litigation and regulatory risk.
User Asset Trends
The increasing risk levels are evident in Coinbase’s user asset trends. While all cryptos are extraordinarily risky, the crypto ecosystem is filled with incredibly risky assets from a permanent capital loss perspective. The following two tables detail the user trends in Q1 2022 compared to Q1 2021 and to the full years 2021, 2020, and 2019. The data was compiled from the SEC filings used thus far and Coinbase’s Q1 2021 8-K filed with the SEC.
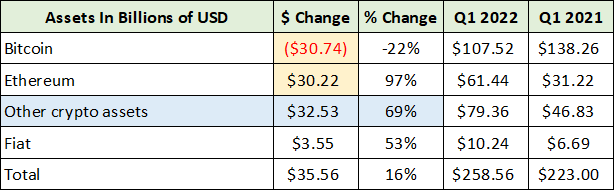
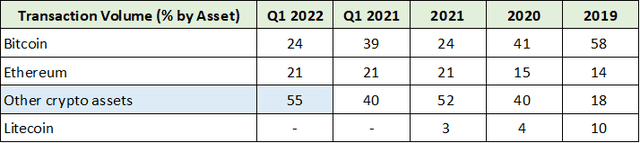
Created by Brian Kapp, stoxdox
I have highlighted in yellow the decline in Bitcoin assets and the increase in Ethereum assets. This looks to be a risk neutral swap by platform users as they offset each other, and they share similar risk characteristics. The increasing risk comes from the growth in other crypto assets which is highlighted in blue. This basket of questionable assets now accounts for fully 55% of transaction volumes. It should be noted that this trend is likely contributing to the plunging retail transaction revenue, as other crypto assets are likely to have smaller transaction amounts given their wildly speculative nature.
Balance Sheet
The bullish thesis for Coinbase, for those that see a prosperous crypto future, rests on its relative financial strength. In the current unfolding crypto market stress, assuming no systemic risk event impairs Coinbase, the company is likely in the best position to consolidate the industry. The following table was compiled from Coinbase’s 2021 10-K and displays my modified balance sheet view. It was compiled prior to the Q1 2022 10-Q release and thus was not updated for the recent quarter.
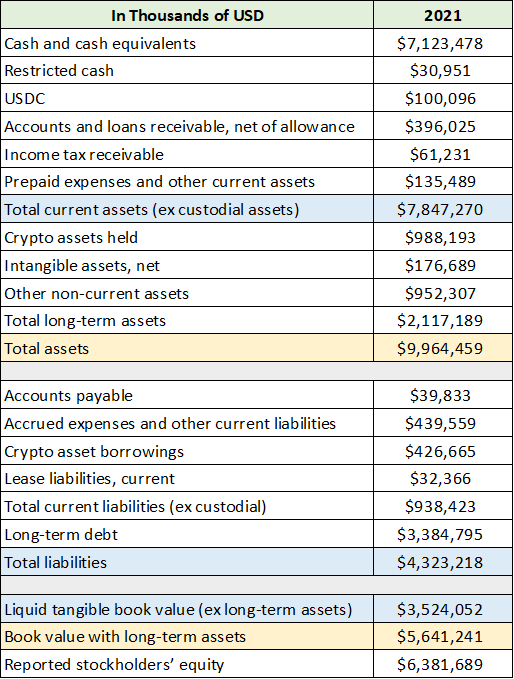
Created by Brian Kapp, stoxdox
I have highlighted in blue what I view as Coinbase’s liquid assets and liabilities. The company has $3.5 billion of net cash as of the end of 2021. If we give the company credit for its long-term assets, which are primarily direct investments in crypto and other crypto companies, Coinbase has a $5.6 billion investment position net of debt (highlighted in yellow).
Interestingly, the company reduced its cash level by $1 billion in Q1 2022 in order to make further crypto and crypto company investments. This appears to be excessive from a time period perspective for such a large amount of investment, and further raises the risk level. In this regard, the company’s first debt maturity is not until 2026, with the remaining in 2028 and 2031. As a result, Coinbase’s use of debt will not become a meaningful cash constraint until the second half of the decade. The following table compiled from the same SEC filing summarizes the debt for those interested.
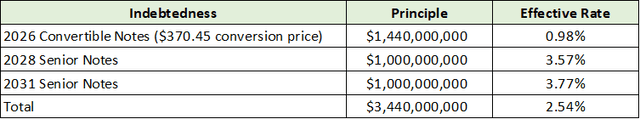
Created by Brian Kapp, stoxdox
Excluding a systemic crypto failure event or related impairment, $3.5 to $5.6 billion is a lot of firepower in an environment of rapidly declining industry valuations. While I am skeptical and view the future of crypto as being largely unquantifiable at this time, if I had a bullish conviction in the industry, Coinbase would represent a top choice.
Technicals
The technical picture is one of well-defined resistance levels with no visible support. With Coinbase down 88% from its highs just over a year ago, it is safe to say that the stock is technically overextended to the downside. The following weekly chart captures the situation well. I have highlighted the upside resistance levels with orange lines.
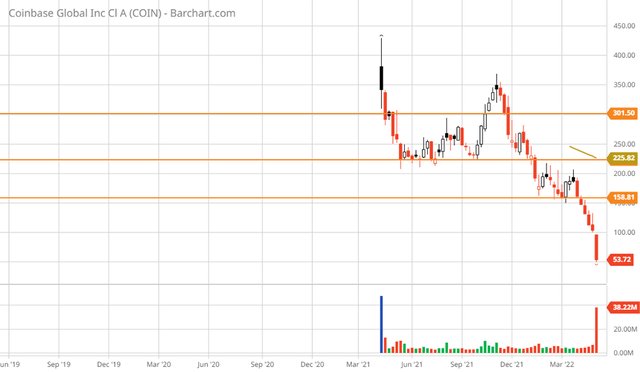
Coinbase weekly chart (Created by Brian Kapp using a chart from Barchart.com)
The upside return potential to each of the resistance levels from the current price of $51 is 212%, 341%, and 490%, respectively. This is a testament to the extraordinarily oversold condition in addition to the unsustainable valuation at the IPO. The following 1-year daily chart provides a closer look.
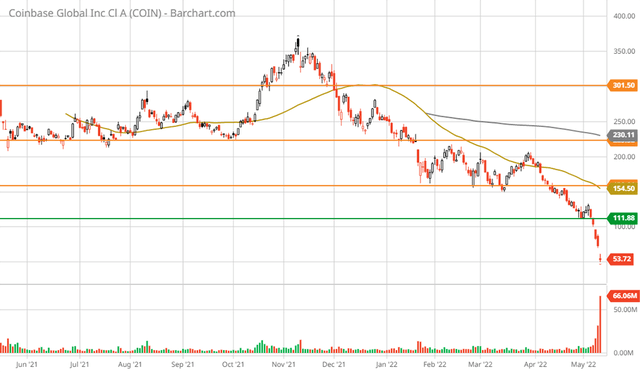
Coinbase 1-year daily chart (Created by Brian Kapp using a chart from Barchart.com)
I have added a daily resistance level represented by the green line. The return potential to this first resistance level is 118%.
Summary
With the stock currently in free fall with no visible technical support, and a transaction-based business model undergoing a fundamental shift, it is exceedingly difficult to estimate the likely downside potential for Coinbase. At the current price, Coinbase is being valued at roughly $13 billion dollars with a $3.5 to 5.6 billion net investment position, ignoring the effects of a potential systemic risk event unfolding in the crypto markets. Systemic risks and the inability to quantify the future of the crypto industry are likely to deter many investors, including myself. That being said, for those that have a bullish conviction in the crypto industry, Coinbase is a top choice, and we are in a buyers market.
Credit: Source link