- Polkadot coin, after a sharp downfall, is now consolidating under the tight range while facing mild resistance of 20-DMA line (red)
- The digital asset is trading on a bearish note as it slipped below all vital moving averages of 20, 50, 100, and 200-day moving average.
- The ratio of DOT/BTC is trading at 0.0004528 BTC with slight gains of +0.18%, and the pair of DOT/ETH is dealing under pressure at 0.00683 ETH with an intraday loss of -3.04%
Polkadot over the monthly chart is trading or consolidating under the tight range after a sharp correction from the higher levels. Moreover, the coin is trying to find its base after strong profit-taking, and soon we can see an upsurge in the upcoming trading session.
Once the coin sustains above 20 and 200-DMA line, a good recovery is expected in upcoming trading sessions. However, volume on the other side is recorded lower and falls below the average line, improving forthcoming trading sessions. Support on the lower side is at $14.70 and $13.00, whereas the higher side’s resistance is at $17.40 and $21.75.
Polkadot Coin is Consolidating Under the Sideways Channel
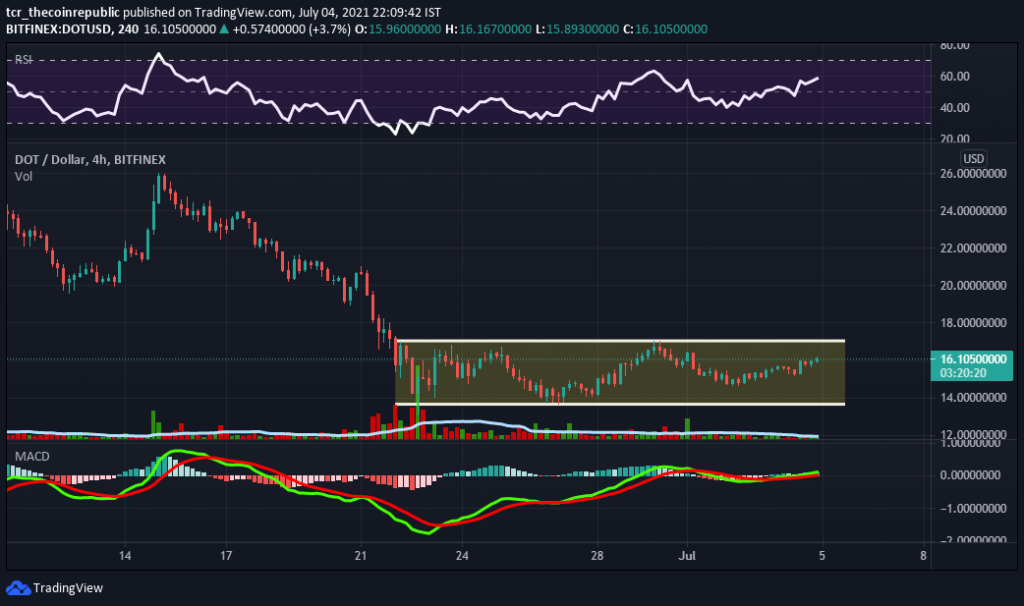
On a weekly chart, the Polkadot coin is consolidating under the sideways pattern or sideways channel. While either side breakout will give a strong momentum in the upcoming trading sessions, but the volume is not supportive at the time of press. Volume needs to improve in forthcoming trading sessions for a positive breakout. Likewise, the technical parameters are a little bullish and need little confirmation for a positive breakout. Presently, the coin is trading at $16.10 with an intraday gain of +2.83%, and the volume to market cap ratio is at 0.04462.
Relative Strength Index (BULLISH): Polkadot coin price RSI presently projects positive or bullish momentum over the weekly chart. In contrast, the RSI is trading higher near the overbought zone with a gradually bullish momentum CMP at 58.
Moving Average Convergence Divergence (BULLISH) currently indicates a bullish trend on the daily chart. This is because the buyer’s signal line (green) overpower the seller’s line (red).
Support levels: $14.70 and $13.00
Resistance levels: $17.40 and $21.75.
Credit: Source link