


This article is an update from the previous technical analysis of Hedera (HBAR).
In recent weeks, we have witnessed a surge in bullish sentiment surrounding HBAR, making it an opportune time to delve into a detailed technical analysis.
Let us explore the key chart patterns and indicators that suggest a bullish momentum for HBAR in the coming weeks.
Weekly Chart
Taking a closer look at the weekly chart, HBAR presents a robust outlook, highlighted by its consistent interaction with crucial support and resistance levels. Notably, the ground level of support has seen four significant touchpoints, underscoring its significance in the price action.
We also observed a downsloping trend line since November 2021; this trend line has been tested three times, functioning as strong resistance. However, in January 2023, it ultimately managed to breach and surpassed the first resistance trendline.
Following a successful breakout, the first resistance trendline now becomes support. In February, the price surged, reaching a peak of $0.9. Subsequently, a prolonged retest phase endured until June.
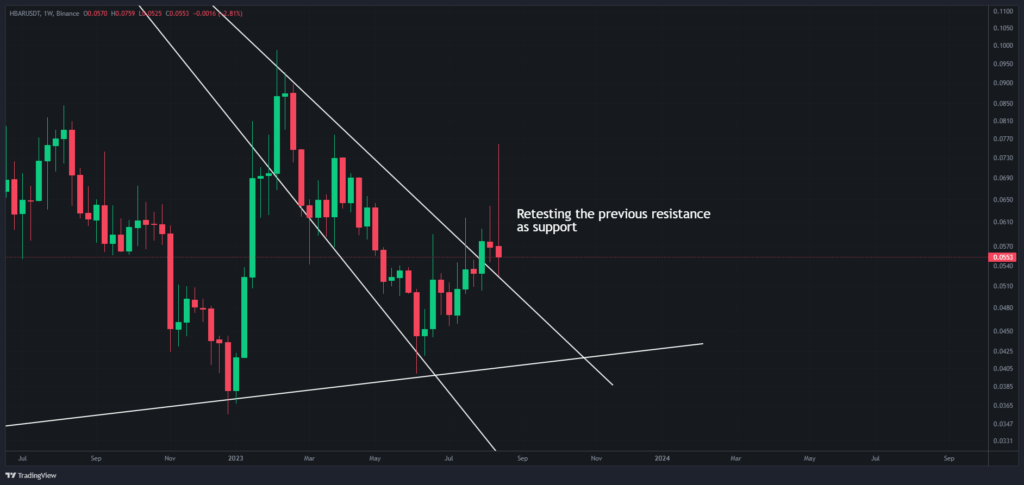
Regarding the second resistance line, the price encountered difficulties in breaking above it. However, the recent development indicates a breakthrough, coupled with subsequent retests, highlighted by a notable wick.
Currently, a significant breakout is unfolding. This holds immense significance, considering it counters a multi-year downtrend–the historical context of the trendlines extends back to 2021.
Potential Level of Resistance
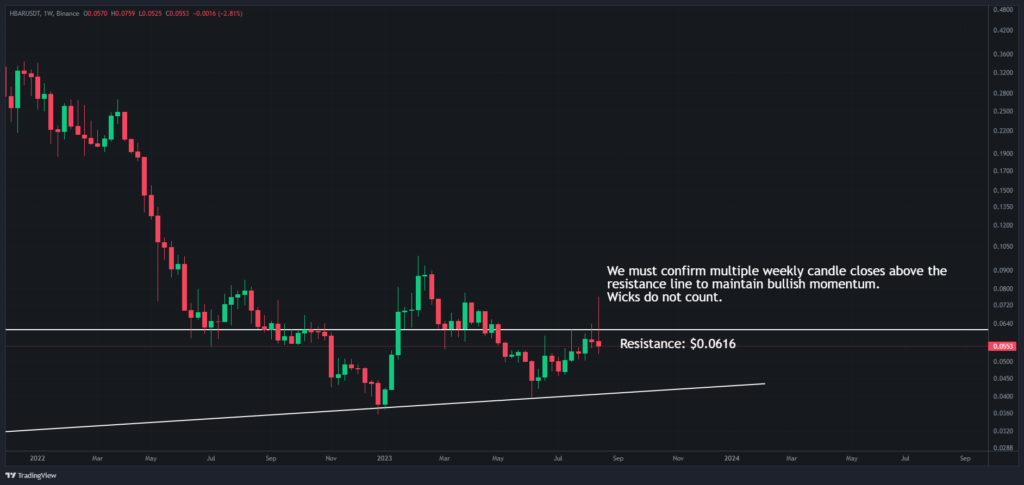
A horizontal trend line drawn from historical data presents a compelling story. Instances from September and October 2022 showcase HBAR’s struggle to breach this line. Moreover, in the wake of a price surge in January 2023, the horizontal trend line held its ground during a retrace in March and April, reinforcing its potency as a potential support/resistance level.
The imminent breakout of HBAR’s price creates an enticing opportunity for traders. If a weekly candle manages to close above this pivotal resistance, it could signal a resounding buy signal for those seeking to capitalize on the bullish trend.
Weekly Stochastic RSI
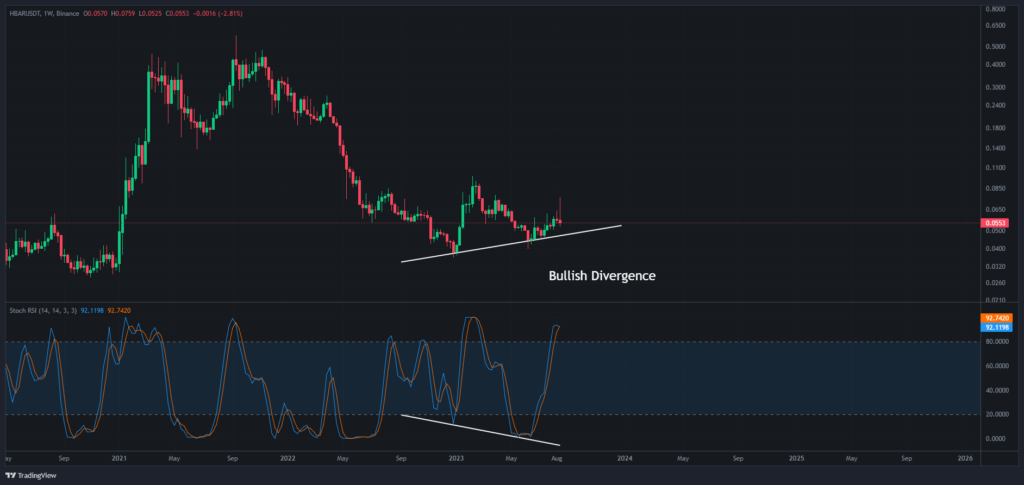
A perceptive observation on the weekly chart is the divergence between price movement and the stochastic oscillator. While the price forms higher lows, the stochastic oscillator displays a bullish divergence with lower lows. This nuanced insight signifies an impending trend reversal, indicating an impending bullish shift in HBAR’s trajectory.
Final Thoughts
As the weeks unfold, HBAR’s technical analysis points towards a promising journey of bullish momentum but we need to wait for confirmation. Armed with historical support and resistance levels, breakout potentials, traders can harness this opportunity for potential gains.
As always, traders should conduct further research and exercise caution before making any investment decisions.

Rickie Sanchez is an article writer specializing in cryptocurrency news. Since late 2017, he has been actively investing in cryptocurrencies. He is enthusiastic about everything that has to do with crypto and he hopes that the readers of his articles in the years to come will gain a massive understanding of blockchain technology.


![BONK, PEPE & Hedera [HBAR]: Best crypto to buy right now!](https://ambcrypto.com/wp-content/uploads/2024/04/Best-crypto-to-buy-right-now-1000x600.png)


