Bitcoin price has developed the necessary conditions for a Point and Figure chart pattern known as a Bear Trap. However, it has also developed conditions favorable for a Bearish Catapult setup. Bitcoin price action on its $1,000/3-box Reversal Point and Figure chart has developed two patterns, one bearish and one bullish. Both represent trades that have high positive expectancy rates. But one trade has significantly more profit potential than the other.
Polkadot bulls pour in and rally DOT higher
Polkadot price could experience an unprecedented spike over the next week and extend into late January 2022. The setup on the $2.00/3-box reversal Point and Figure chart indicates a more than 300% move higher from the present value area. Polkadot price has a strong bullish reversal Point and Figure chart pattern developing. That pattern is known as a Spike Pattern. A Spike Pattern is any columns of Xs or Os with fifteen or more boxes.
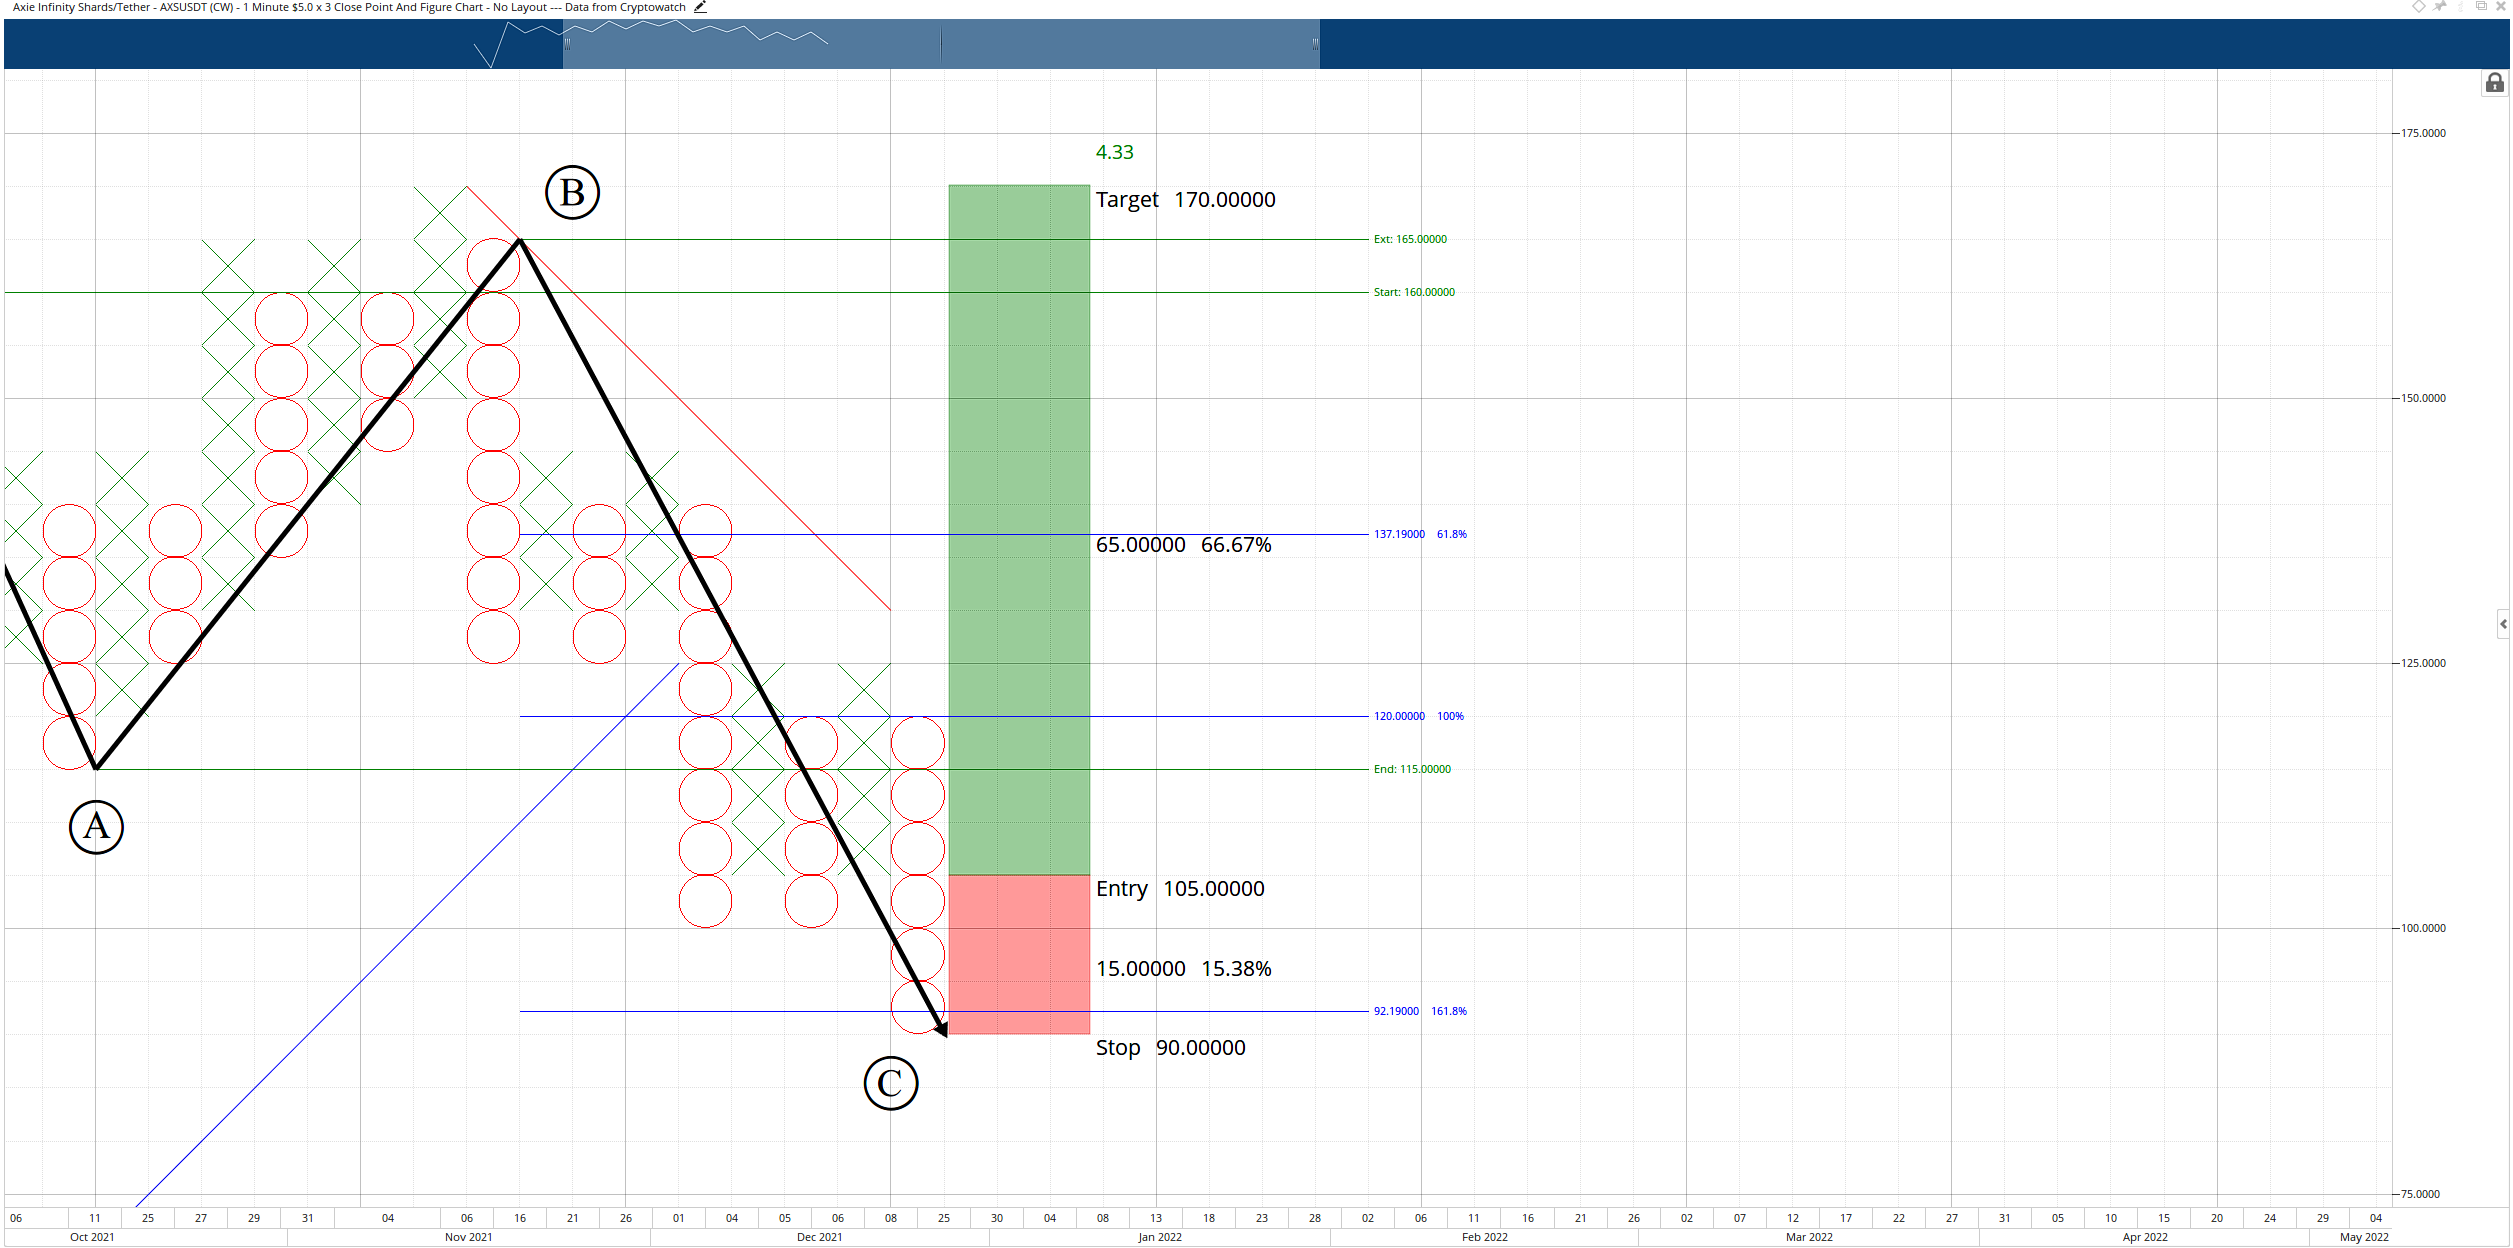
Axie Infinity presents buy opportunity before AXS hits $170
Axie Infinity price action has an outstanding bullish early entry opportunity coming up. An A-B-C Corrective Wave was likely completed when Axie Infinity hit the 161.8% Fibonacci retracement near $90. That move simultaneously created the conditions necessary for one of the most sought-after bullish reversal patterns in Point and Figure Analysis: the Bullish Shakeout.
Credit: Source link