
- XRP price shows an inability to remain above the $0.60 support zone, threatening a move lower.
- Oscillator values indicate that a higher move is likely, but a sharp lower hook indicates a continuation south.
- Upside potential remains strong, but bulls must follow through.
XRP price shows signs of breaking out below essential support structure, initiating another push south. A particularly bearish setup in the Point and Figure chart shows how ugly XRP’s drop could get. Nevertheless, despite the warning signs of bearish continuation, there is an opportunity for XRP to return toward the $0.75 value area.
XRP price needs buyers to pour in, or Ripple will likely nosedive
XRP price has developed two trading ideas for the long and short sides. The first is a theoretical short entry with a sell stop order at $0.54, a stop loss at $0.62, and a profit target at $0.30. The trade idea represents a 3:1 reward/risk. The entry is based on a Bear Trap pattern on the $0.02/3-box reversal Point and Figure chart. A two-box trailing stop would help protect any implied profit made post entry.
XRP/USD $0.02/3-box Reversal Point and Figure Chart
The short entry is invalidated if the current X-column moves to $0.70.
On the long side of the market, there is a hypothetical long entry with a buy stop order at $0.63, a stop loss at $0.59, and a profit target at $0.77. This trade idea has a 3.50:1 reward/risk. The entry is on the three-box reversal of the current O-column. XRP price can move two more Os to $0.57 and remain a valid setup. The buy stop would follow any move lower in tandem with the price drop, as would the stop loss. However, the profit target remains the same.
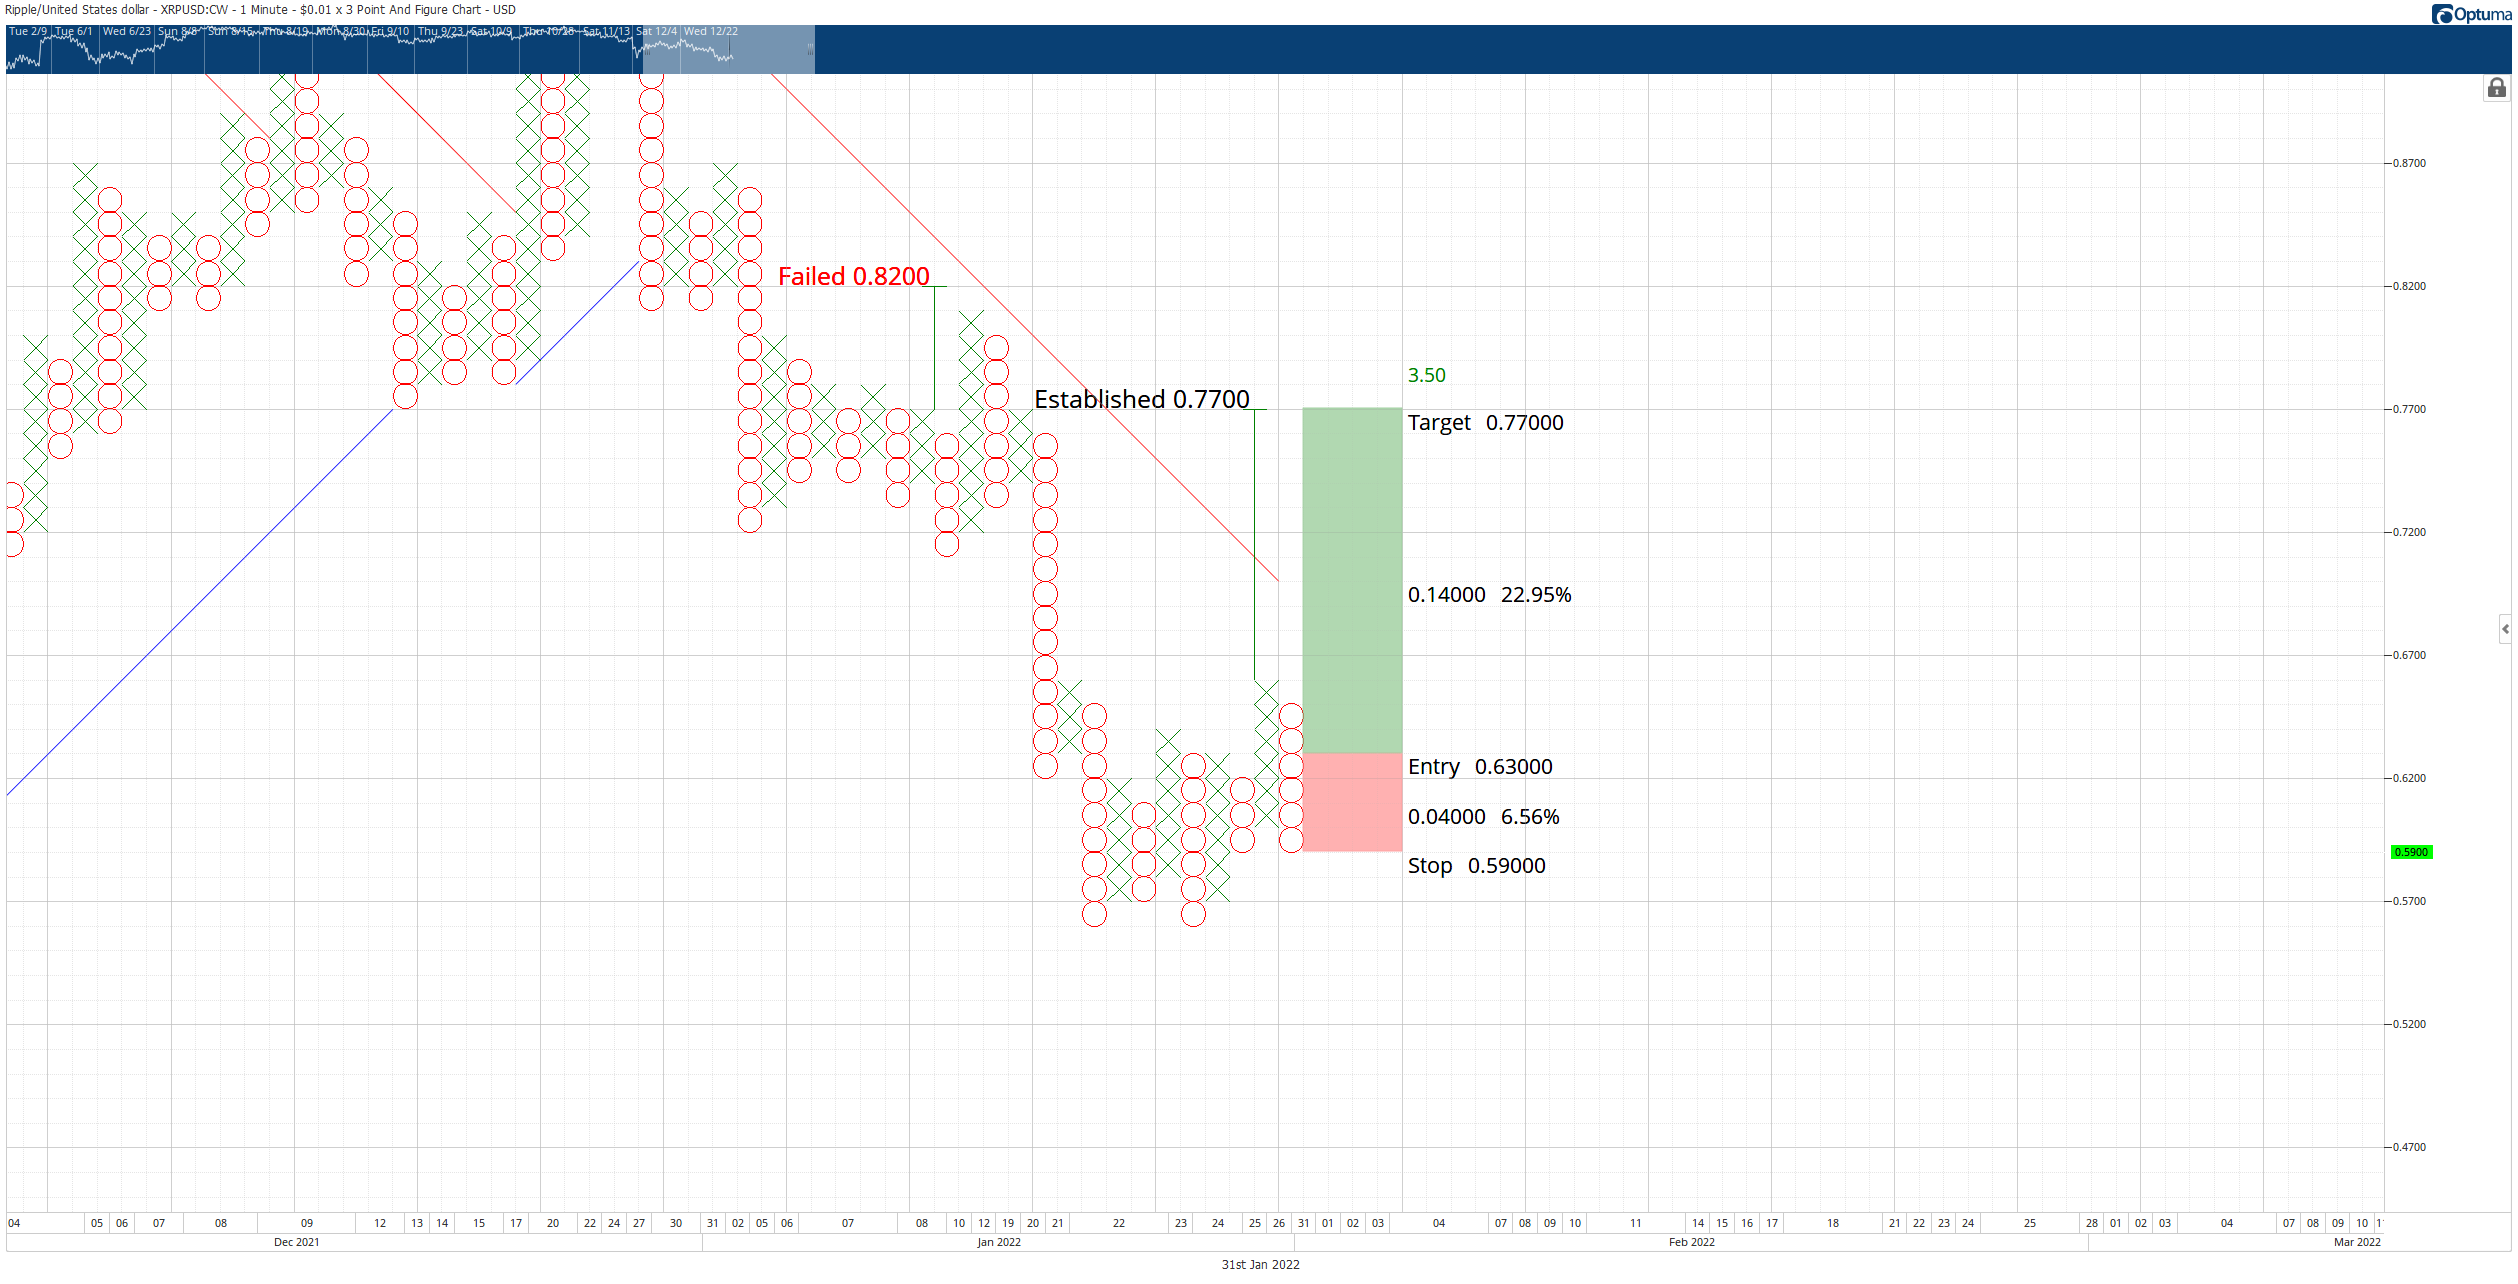
$0.01/3-box Reversal Point and Figure Chart
If XRP price moves to $0.56 in the current X-column, the hypothetical long trade setup is no longer valid.
Credit: Source link