The Hourly View for XRP
Last Updated December 15, 2020, 01:017 GMT
At the moment, XRP’s price is down $0 (-0.64%) from the hour prior. XRP has seen its price go down 8 out of the past 10 hours, thus creating some compelling opportunities for bears. As for the trend on the hourly timeframe, we see the clearest trend on the 20 hour timeframe. The moving averages on the hourly timeframe suggest a bullishness in price, as the 20, 50, 100 and 200 are all in a bullish alignment — meaning the shorter durations are above the longer duration averages, implying a sound upward trend.
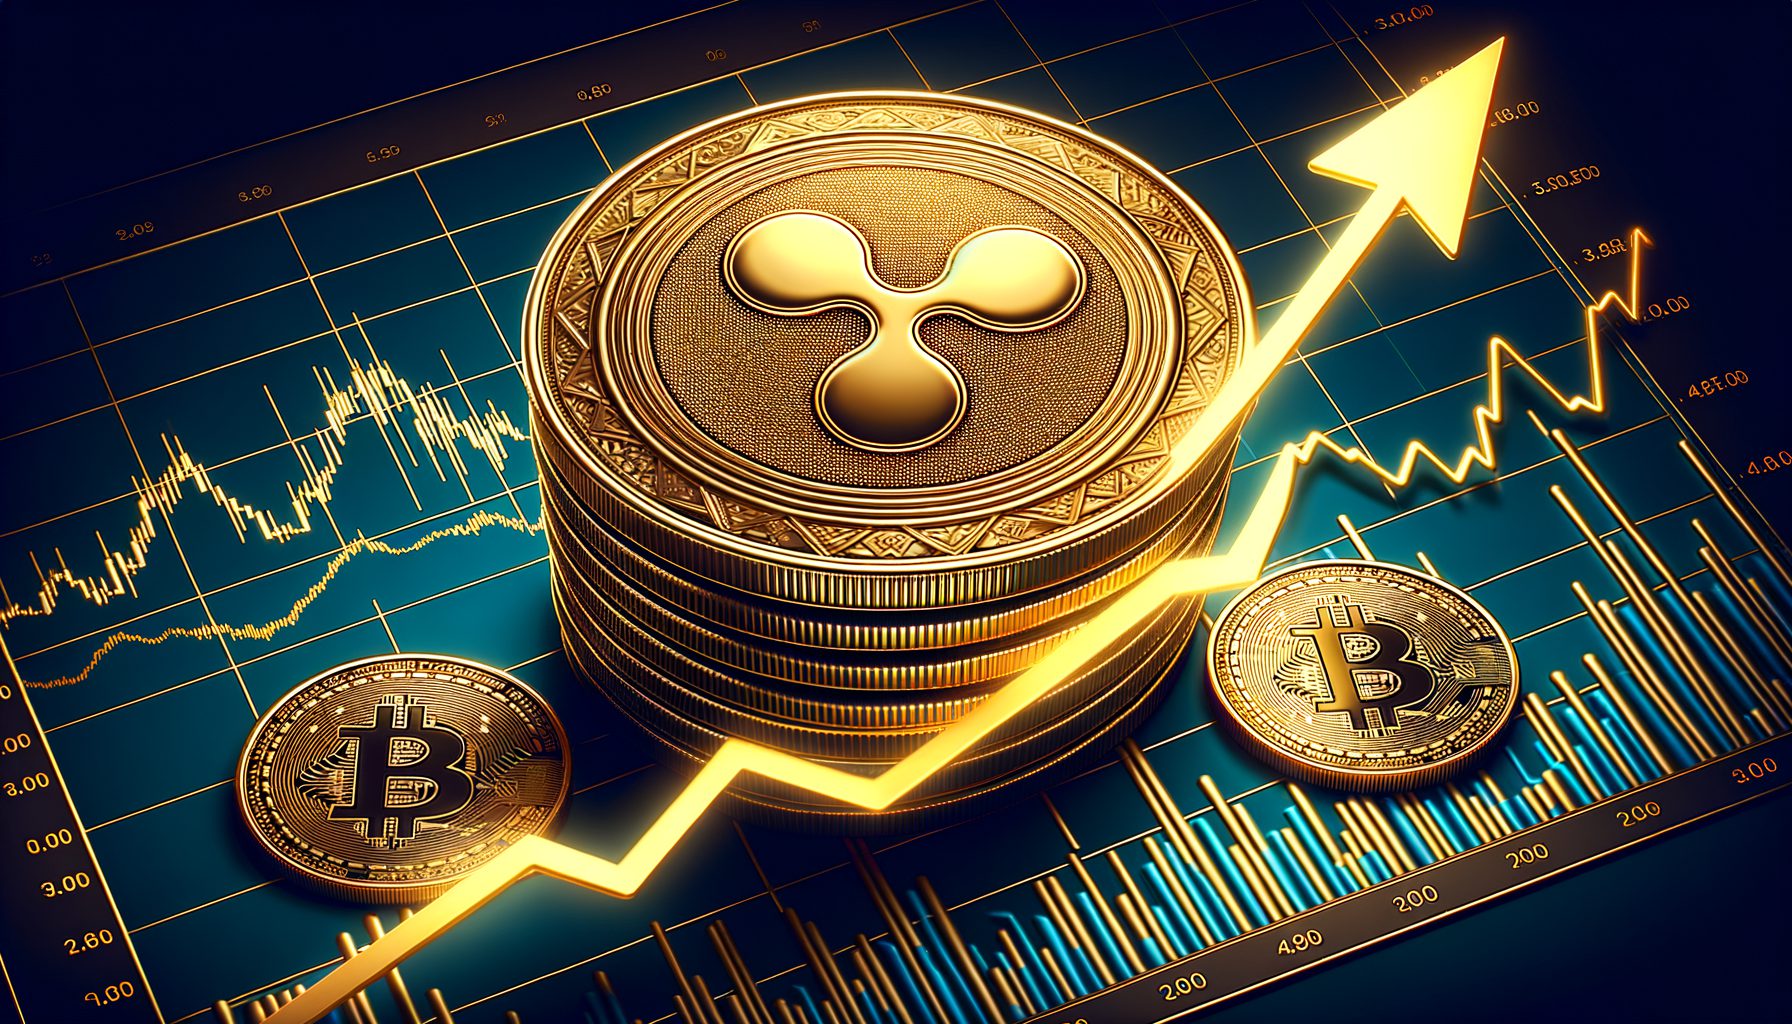
Ripple Daily Price Recap
Ripple is up 1.28% ($0.0065) since the previous day, marking a reversal from the day prior — and the end of a 3 day negative run. This move happened on lower volume, as yesterday’s volume was down 51.5% from the day before — and down 31.22% from the same day the week before. Those trading within the Top Cryptos asset class should know that Ripple was the worst performer in the class during the previous day. The daily price chart of Ripple below illustrates.
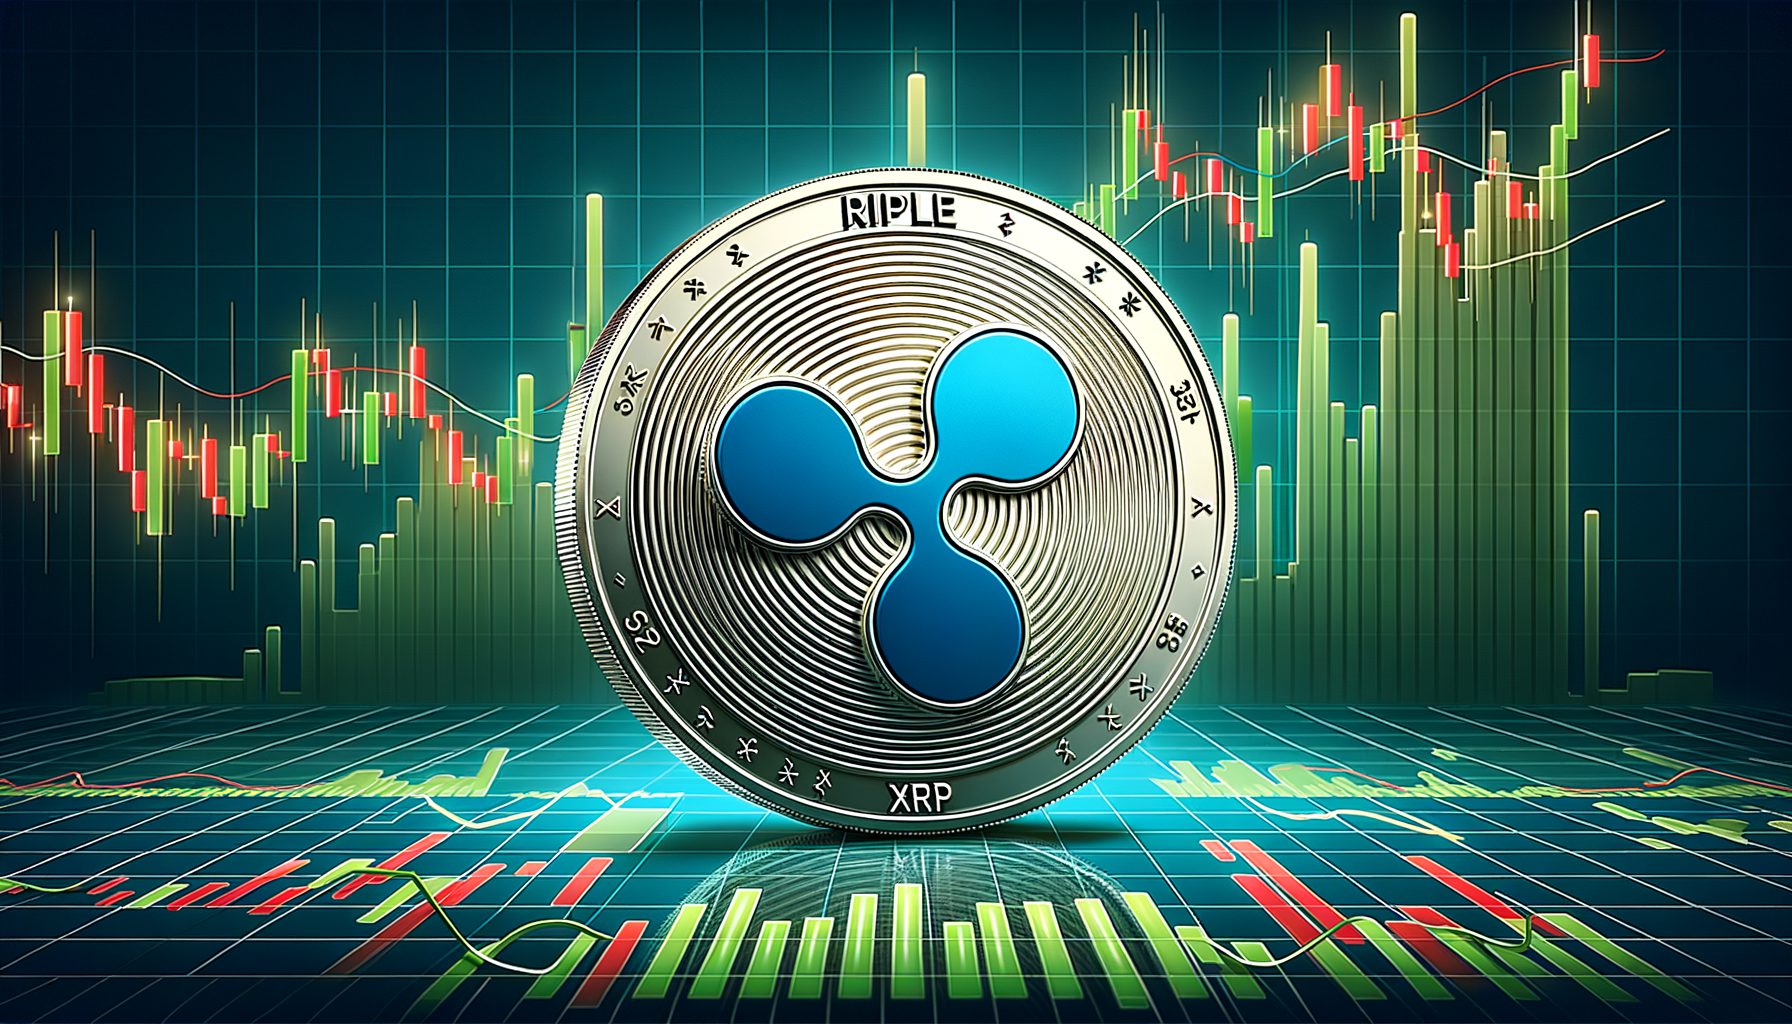
Ripple Technical Analysis
Volatility for Ripple has been contracting over the past two weeks relative to volatility over the past month. Whether volatility reverts will be something to watch. Trend traders will want to observe that the strongest trend appears on the 90 day horizon; over that time period, price has been moving up. It should be noted, though, that a trend in the opposite direction, going down, exists on the 14 day timeframe. This may setup an interesting opportunity for traders looking to buy dips in anticipation of the primary trend resuming. Or to view things another way, note that out of the past 10 days Ripple’s price has gone down 6 them.