


- Solana price struggles to maintain the gains it made on Wednesday.
- Nearly all risk-on assets globally are under renewed selling pressure.
- Long opportunities do exist but require significant confirmation to mitigate risk.
Solana price continues to slide south as all of the post-Fed gains have thus far been wiped out.
Solana price action in a tough spot
Solana price, like the majority of the broader cryptocurrency market, experienced a major rally after the US Federal reserve confirmed another rate hike. SOL closed the Wednesday trade higher by nearly 9%, but is on track to lose all of those gains – and then some more. However, opportunities on the long and short side of the market are now present.
A theoretical long opportunity for Solana price exists on the daily Ichimoku Kinko Hyo chart with a buy stop order at $120, a stop loss at $105, and a profit target at $187. The long entry is based on the confirmation of an Ideal Bullish Ichimoku Breakout – a strong signal that a new and prolonged uptrend is likely to continue.
SOL/USD Daily Ichimoku Kinko Hyo Chart
The theoretical long setup represents a 4.47:1 reward for the risk. The projected profit target is just below the 161.8% Fibonacci expansion. Some profit-taking near the 100% Fibonacci expansion at $147 is likely to occur.
The long trade idea is invalidated if Solana price hits $75 before the entry is triggered.
Solana price has a strong probability of continuing the current downtrend on the short side of the market. On the $2.00/3-box reversal Point and Figure chart, SOL has a hypothetical short entry with a sell stop at $88, a stop loss at $96, and a profit target at $50.
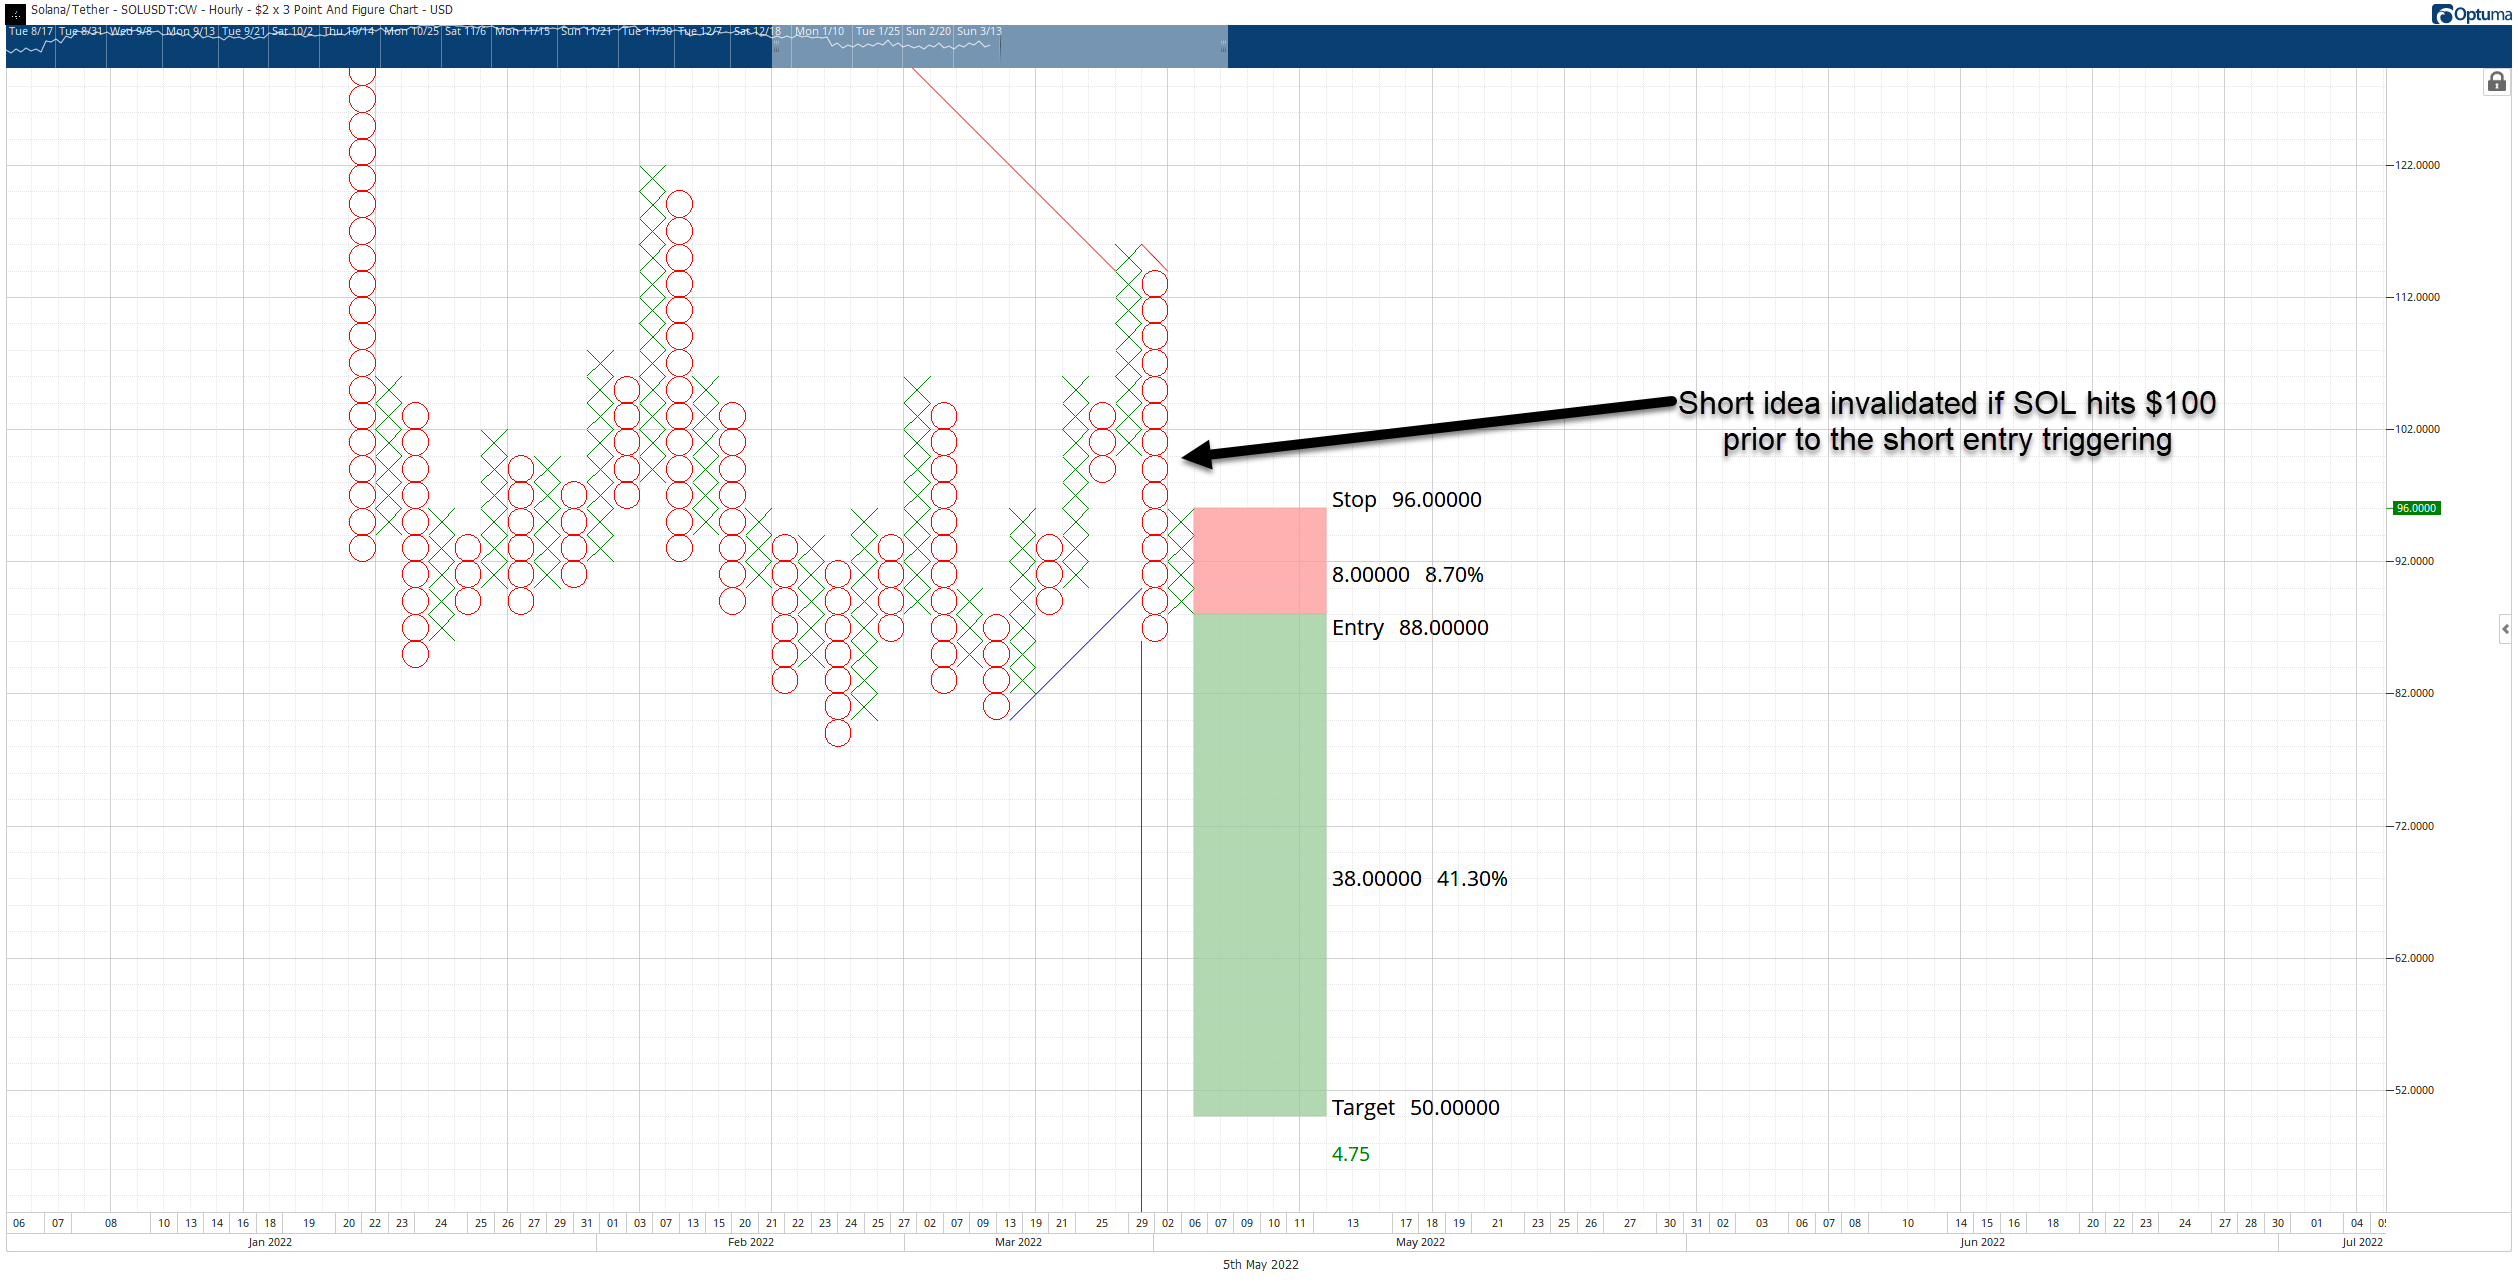
SOL/USD $2.00/3-box reversal Point and Figure Chart
The theoretical short entry is based on a pattern in Point and Figure analysis known as a Pole Pattern. The entry occurs if the current X-column fails to reach 50% of the prior O-column. If Solana price moves to $100 before triggering, the short entry is invalidated.
Credit: Source link


:quality(70)/cloudfront-eu-central-1.images.arcpublishing.com/dlnews/BDECL3R7LVALPHP7OXEWKOPXQM.jpg)


