


- DOT (Polkadot) dumped below its previous low
- ARB (Arbitrum) In a situation of free fall
- HBAR and NEAR are showing no signs of life
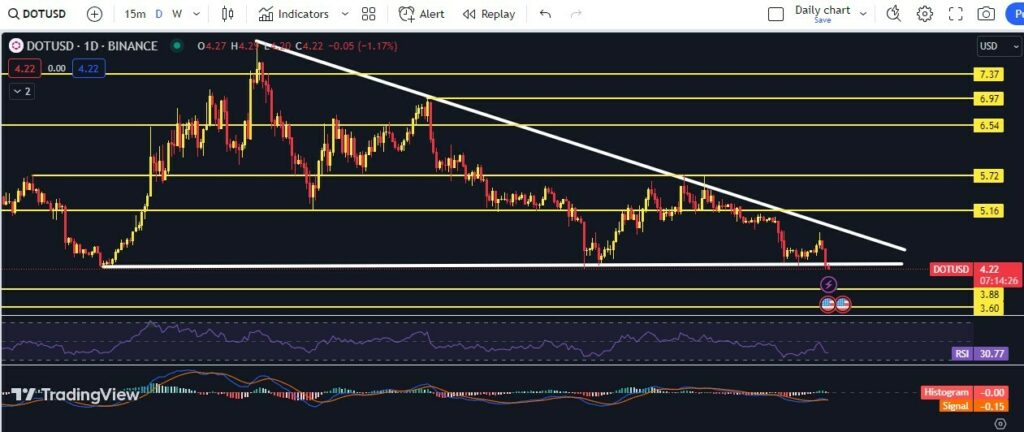
Polkadot (DOT):
- DOT is trading at $4.22, experiencing a 1.7% decrease, with a market capitalization of $5,167,457,914.
- DOT is currently trading within a descending triangle. However, it is trading below the support line, indicating that the support has already been breached. We should wait for support to either be reclaimed or retested as resistance.
- The next support levels for DOT are approximately $3.9 and $3.6. These levels represent the horizontal supports preceding the bull run and DOT’s all-time high.
- The Moving Average Convergence Divergence (MACD) is displaying a bearish crossover, while a hidden bullish divergence is observable in the Relative Strength Index (RSI).
READ MORE: Over 30,000 Bitcoin Withdrawals Preceding Grayscale’s Victory Hint at Price Manipulation
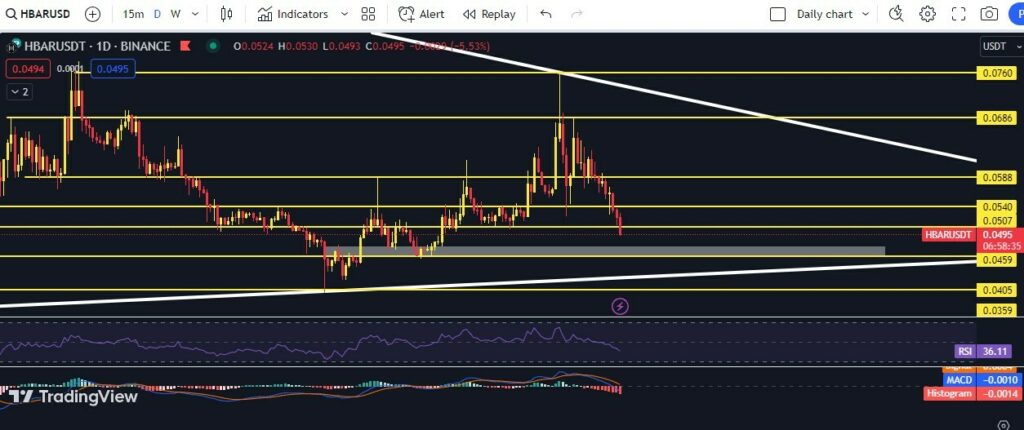
Hedera (HBAR):
- HBAR is trading at $0.0494, reflecting a 5.92% decrease in its price, with a market cap of $1,643,749,141.
- HBAR is currently trading within a symmetrical triangle and has broken below its horizontal support at $0.0507. The next support level for HBAR is at $0.046, coinciding with the 0.786 Fibonacci retracement level from the previous HBAR price surge.
- The Technical Indicator Moving Average Convergence Divergence (MACD) is in bearish territory, and the Relative Strength Index (RSI) stands at 35, indicating potential downward movement in the near future.
READ MORE: These 3 whales knew dump was coming and sold $264 million of Bitcoin and Ethereum: Significant Crypto Transactions Explained past 24 hours
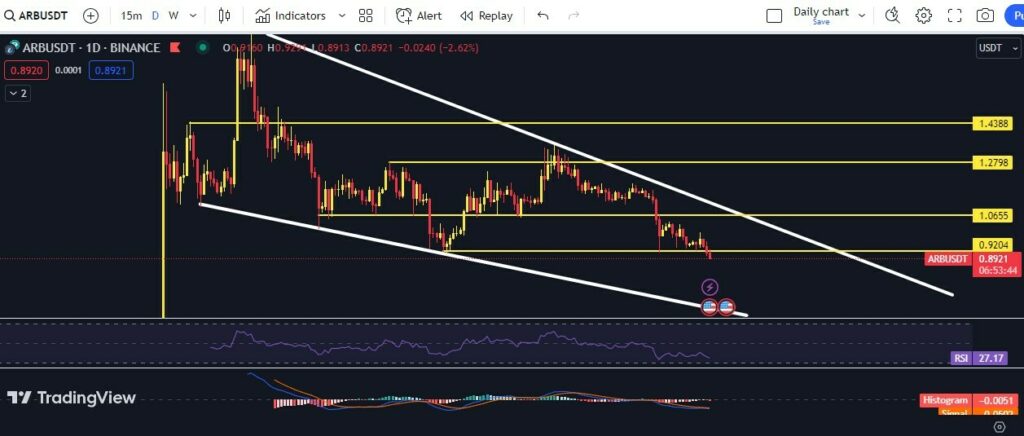
Arbitrum (ARB):
- ARB is trading at $0.8935, marking a 2.47% decrease in its price, with a market cap of $1,148,435,019.
- ARB is currently trading within a descending wedge, and it has recently broken its previous horizontal support. ARB is exhibiting a Lower-High and Lower-Low structure at the moment.
- ARB is currently in a freefall condition, with the Technical Indicator Moving Average Convergence Divergence also indicating bearish sentiment. The Relative Strength Index reflects hidden bullish divergence.
ALSO READ: Bitcoin Cash (BCH) and Ripple’s (XRP) Performance in the Wake of Grayscale’s Legal Victory
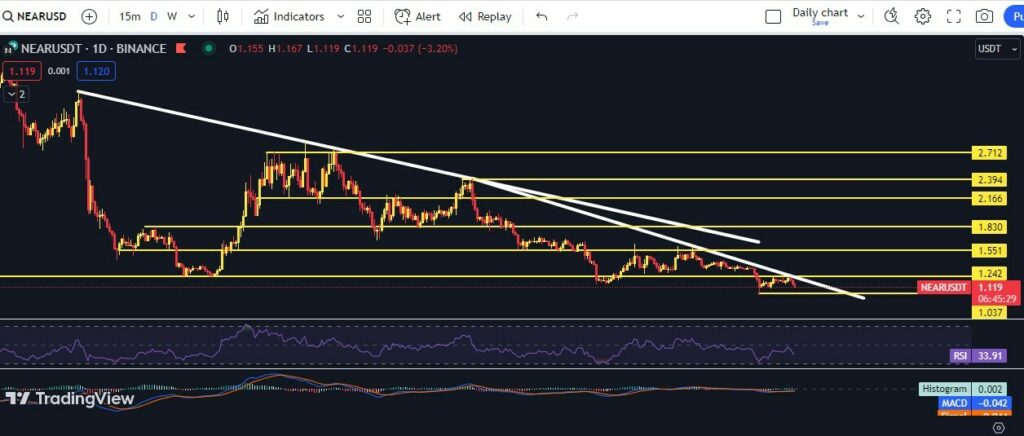
Near Protocol (NEAR):
- Near is trading at $1.117, representing a 3.46% loss in value, with a current market cap of $1,055,351,653.
- Near was previously trading within a descending triangle, and the lower trendline of the triangle has been breached. Near is experiencing a downtrend, and its current support level is approximately $1.04.
- The Technical Indicator Relative Strength Index (RSI) does not indicate any signs of relief at the moment, while the Moving Average Convergence Divergence is in positive territory. However, there is a lack of momentum in the market, and further downside movement for Near is anticipated.
IMPORTANT TOPIC: Introducing POL: Polygon’s Next-Gen Token Upgrade
Conclusion:
DOT is experiencing a decrease in price and is currently trading below a critical support level, while technical indicators suggest a mixed outlook with a bearish MACD and a hidden bullish divergence in RSI.
HBAR has broken below its horizontal support and is trading within a symmetrical triangle, with indicators signaling a potential downward movement.
ARB is trading within a descending wedge and exhibits a Lower-High and Lower-Low structure, indicating a bearish trend with bearish indicators.
Near has broken below a descending triangle and is currently experiencing a downturn, with the RSI not indicating any relief in the near term and a lack of momentum in the market.
Investors should closely monitor these cryptocurrencies and consider the technical indicators, support levels, and overall market sentiment before making any trading decisions. Market conditions can change rapidly, and it’s essential to stay informed and adapt to the evolving cryptocurrency landscape.
Chart from Tradingview


