Cindy Ord/Getty Images Entertainment
“It’s always darkest just before dawn.” – an uplifting proverb with many sources
“It’s always darkest just before it’s pitch black,” – a less uplifting rejoinder


Ark Innovation ETF (ARKK) has fallen hard since the beginning of 2022 because its investors have continued to come to their senses. Unfortunately, it is too late for many of them. ARKK is certain to be remembered in financial history as the quintessence of disastrous speculation during the speculative bubble of the early 2020s. In its eight years of existence it is has destroyed more capital for more naive and innocent investors than any other investment vehicle of its time. This judgment may seem brutal and blunt, but there is no substitute for telling the true facts.
Speculative periods of the sort we have recently experienced happen periodically in financial markets. They usually begin with very real innovation which produces changes in the way the economic world operates. A narrative emerges which exaggerates and places a positive spin on innovations of all sorts. In the years leading up to 2000 it was the internet and the dot-com companies which appeared to exploit it. Only a few of these companies survived the 2000-2003 Crash but after twenty years it is easy to remember the few which did with Amazon (AMZN) being the prime example. It’s the winners which stick in the popular mind.
Those who bought Amazon early and hung on during the Crash of 2000-2003 have done extremely well. Market legends were built on it. Another popular favorite was Cisco Systems (CSCO), which also survived and continued to have good growth in earnings over the decades that followed. Unfortunately for investors who came in around the 2000 peak Cisco’s stock price has not yet recovered its 2000 high. Those who bought Cisco at the bottom of the Crash and added over the following decade have done reasonably well. The success of Amazon serves to obscure the outcome for the majority of investors in dot-com stocks who were wiped out and never returned to the market.
Periods like the present occur when enough time has elapsed from the last such period that most of the investors damaged in the previous market frenzy have disappeared from the scene. After several years of building enthusiasm a new wave of innocents with no memory of the past enter the market. Making money in the market once again looks easy. Vehicles like the Ark Innovation ETF make it look like a piece of cake. Many of the individual stocks held in ARKK looked like long term winners right up to February 2021.
ARKK was the perfect vehicle for a fresh generation of naive investors who overestimated their own competence. Most did not know enough to grasp what they didn’t know. Whether ARKK’s founder, Cathie Wood, understood what the risks were I can’t say. I have no special access to her thinking. The fund made her a household name and also made her a great deal of money. With an expense rate of .75% investors had a substantial hurdle to overcome. Near the top in market prices the Ark ETF management received over $200 million annually taken off the top of Assets Under Management. Don’t cry for Cathie Wood or her chief analyst Brett Minton (pictured above). They did fine.

It’s entirely possible that Cathie Wood herself was simply a true believer who came upon what seemed at the time to be a great idea. There is no question that she is very smart. A summa cum laude graduate of the University of Southern California she was a favorite student of economist Arthur Laffer. She is frequently described as a devout Catholic and in fact named her ETF after the Ark of the Covenant. That’s the same Biblical Ark as in the Harrison Ford movie Raiders of the Lost Ark. If you haven’t seen it in a long time, you might give it another look as I recently did. You will enjoy Indiana Jones shooting the bad guy who is doing fancy sword tricks and then crawling all the way under a rapidly moving truck to toss the bad guys out the window. Pay special attention to the final action scene in which the Nazis open the Ark and promptly crumble into dust.
The concept of innovation is virtually irresistible in the contemporary world, and when we see something that looks like innovation its is hard to stop and think in practical terms about the risks and the performance numbers that would be required over many years into the future to justify the valuation and produce satisfactory returns. The Cathie Wood approach seemed to work well enough for a while, long enough to pull in large amounts of cash. Most investors in the Ark Innovation ETF arrived just in time to see 60% of their capital vaporized. Comparatively few investors made money in ARKK. The great majority lost money in a big way. This very good article by Morningstar’s Amy Arnott entitled “ARKK: An Object Lesson in How Not To Invest” documented the disaster.
Charts And A Table Tell An Unfortunate Story
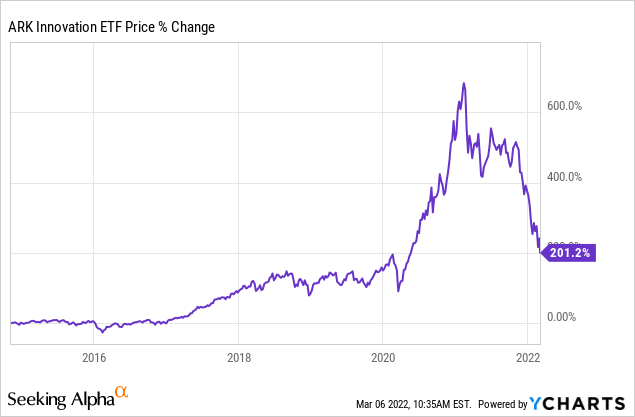
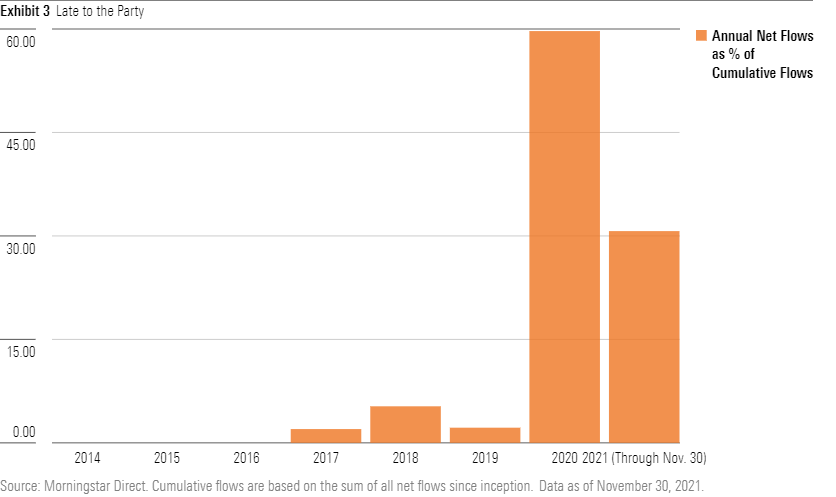
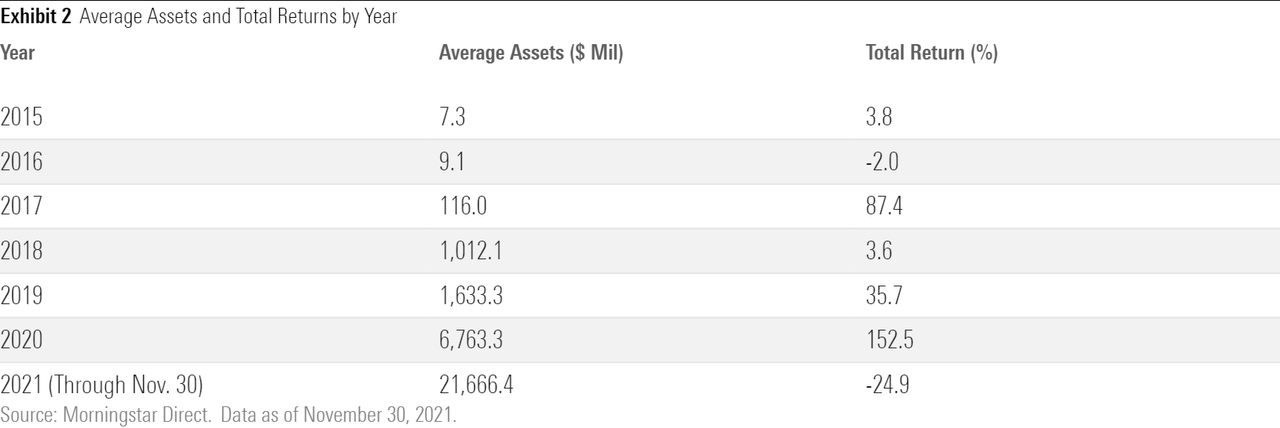
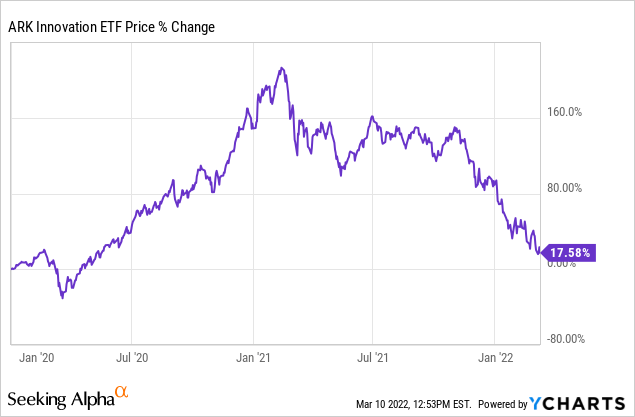
The first price chart below by Y Charts contains the entire history of Ark Innovation ETF beginning on November, 5. 2014. It did very little over its first two years, a mere 2% return, but heated up in 2017 with an 87% return mainly due to a single stock, Greyscale Bitcoin Trust (OTC:GBTC), which was up 1600%. Still, by the middle of 2018 the assets under management were a modest $1.1 billion. In the second chart below, an orange bar chart provided by Morningstar, assets had barely become visible before 2017, rose in 2018, and declined in 2019 after 2018 Total Returns were actually negative. The table which follows, Average Assets and Total Returns, puts hard numbers on the the fact that that very few investors owned ARKK early enough to profit from the sharp rise but many owned it during the devastating decline which followed.
Morningstar
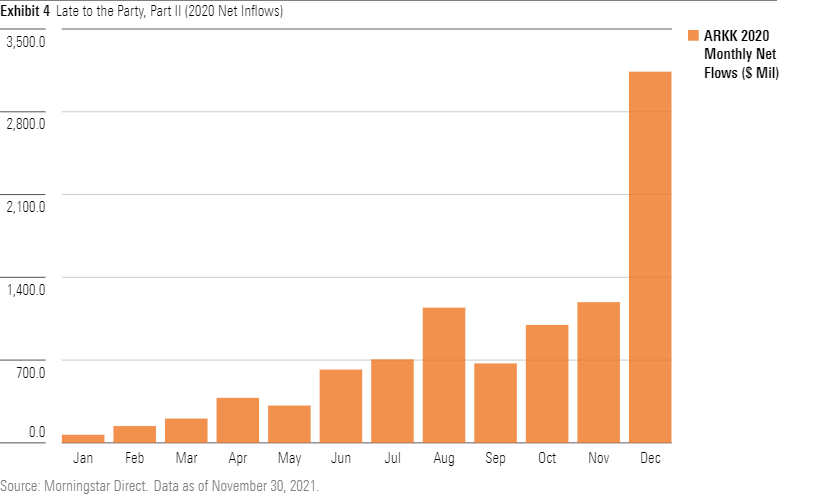
The second bar chart below zooms in to show 2020 in month-by-month detail and is followed by a table which provides hard numbers detailing the increase in Assets Under Management as the price of Ark Innovation rose.
Morningstar
Morningstar
The second Y Chart of ARRK’s stock price shows the way ARKK took off in 2020 from the pandemic market bottom on March 23, 2020. Growth stocks in general and hyper growth stocks in particular took off into a year-long vertical ascent as the lock down favored businesses that operated at a distance and didn’t require direct contact with customers. Extremely low interest rates further advantaged assets with presumed high returns in the distant future. The wind was at the back of Ark Innovation ETF in every possible way. This was Cathie Wood Heaven. It was an environment in which few bothered to look closely at the prospects for speculative market leaders when the pandemic receded, nor did many investors bother to look at what discounted future return would look like if rates began to rise. This is exactly what the most overpriced parts of the market look like in the final stages of a bubble and the early stages of a collapse. The prevailing winds were clearly driving the high-revenue-growth hyper-high-priced hyper-speculative stocks contained in ARK Innovation ETF…until they weren’t.
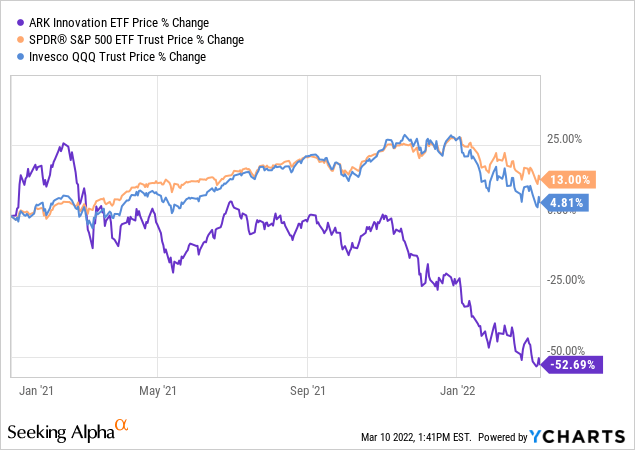
A shorter term chart of ARKK starting at the beginning of 2021 also shows what the end of a bubble and the ensuing crash look like. Notice that ARKK, pumped up by the crazier and more speculative stocks, raced up faster and then fell much harder than even the tech heavy NASDAQ 100 index. I threw in the S&P 500 Index (SPY) just to show what a more balanced cross section of the market was doing. Young, enthusiastic, and inexperienced investors rushed in where angels feared to tread. As ARKK collapsed they were stunned and wondered what had happened to them.
The table below extends the bar charts above into 2022 and provides a graphic image of what happened as ARKK hit its February peak and unraveled. As the stock price began its precipitous decline, investors ran to the exits as if someone had shouted “Fire!” in a jam-packed theater. In a sense, that’s exactly what had happened. It’s their savings that were on fire. The tragedy is that so few investors won and so many lost. The whole round trip in ARKK provided what can be a useful lesson and the first step on the road to reasonable investing.
Morningstar
That’s the story of what happened to ARKK and its investors over the course of its history and the recent past. To assess the future there are two factors:
- ARKK’s holdings.
- What happened to stocks like these in the past.
What Are ARKK”s Holdings And What Can Happen To Stocks Like These?
Below is the full list of ARKK holdings followed by ticker symbol and percentage of the ARKK portfolio. The first twelve holdings amount to about 2/3 of the total dollar value. All have good revenue growth in the rear view mirror, some at a rate of 100% a year, others only around 20-25% and the majority in the middle. I should note that the numbers and holdings were current as I started this article but there have recently been daily changes.
There are two ways of looking at super high growth. On the one hand it is a great thing; on the other hand the highest levels of growth are hard to sustain as each year grows from a higher base. Profits have generally trailed revenue growth, a phenomenon which is not uncommon for growth stocks. None of the ARKK stocks pay a dividend. Using data from the Cash Flow numbers reached through clicking on Financials I noted in parentheses whether or not the company had positive free cash flow:
- TESLA (TSLA) 9.33% (positive cash flow)
- TELADOC HEALTH INC (TDOC) 7.03% (positive cash flow)
- ROKU INC (ROKU) 6.76% (positive cash flow)
- ZOOM VIDEO COMMUNICATIONS-A (ZM) 6.14% (positive cash flow)
- COINBASE GLOBAL INC -CLASS A (COIN) 5.78% (positive cash flow)
- EXACT SCIENCES CORP (EXAS) 5.25% (negative cash flow)
- BLOCK INC (SQ) 5.05% (positive cash flow)
- UNITY SOFTWARE INC (U) 91332U101 4.85% (negative cash flow)
- UIPATH INC – CLASS A (PATH) 4.26% (negative cash flow)
- TWILIO INC – A (TWLO) 4.25% (negative cash flow)
- SPOTIFY TECHNOLOGY SA (SPOT) 3.89% (positive cash flow)
- INTELLIA THERAPEUTICS INC (NTLA) 3.81% (negative cash flow)
- BEAM THERAPEUTICS INC (BEAM) 3.77% (negative cash flow)
- CRISPR THERAPEUTICS AG (CRSP) 3.10% (negative cash flow)
- DRAFTKINGS INC – CL A (DKNG) 2.68% (negative cash flow)
- SHOPIFY INC – CLASS A (SHOP) 2.67% (positive cash flow)
- PAGERDUTY INC (PD) 2.11% (negative cash flow)
- ROBINHOOD MARKETS INC – A (HOOD) 1.82% (negative cash flow)
- FATE THERAPEUTICS INC (FATE) 1.80% (negative cash flow)
- 10X GENOMICS INC-CLASS A (TXG) 1.58% (negative cash flow)
- SIGNIFY HEALTH INC -CLASS A (SGFY) 1.51% (positive cash flow)
- INVITAE CORP (NVTA) 1.43% (negative cash flow)
- ROBLOX CORP -CLASS A (RBLX) 1.41% (positive cash flow)
- PACIFIC BIOSCIENCES OF CALIF (PACB) 1.24% (negative cash flow)
- GINKGO BIOWORKS HOLDINGS INC (DNA) 1.20% (no data available)
- VERACYTE INC (VCYT) 1.13% (negative cash flow)
- TWIST BIOSCIENCE CORP (TWST) 1.05% (negative cash flow)
- STRATASYS LTD (SSYS) 0.97% (negative cash flow)
- TUSIMPLE HOLDINGS INC – A (TSP) 0.97% (negative cash flow)
- SEA LTD-ADR (SE) 0.95% (positive cash flow)
- MATERIALISE NV-ADR (MTLS) 0.68% (positive cash flow)
- 2U INC (TWOU) 0.54% (negative cash flow)
- CERUS CORP (CERS) 0.51% (negative cash flow)
- BERKELEY LIGHTS INC (BLI) 0.28% (positive cash flow)
- COMPUGEN LTD (CGEN) 0.16% (negative cash flow)
- DREYFUS GOVT CASH MAN INS 0.03%
Thirteen of the thirty-five holdings have positive cash flow at the present moment, while twenty-two do not. The holding with the most significant earnings and cash flow is Tesla. Below are the one-year charts of the top five holdings:
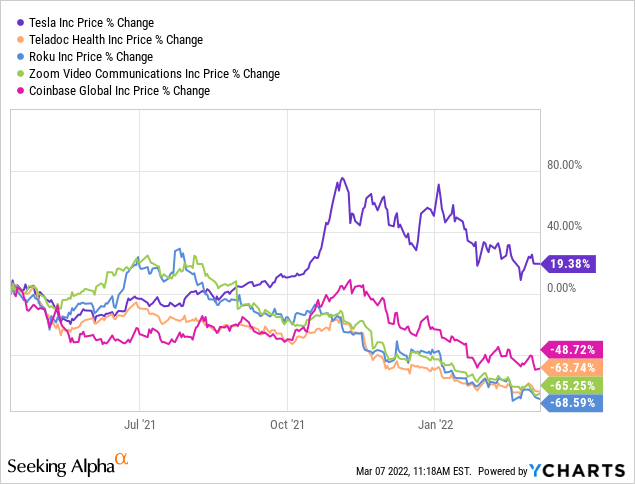
Referring to the previous section please look at the graphs for Assets Under Management. Tesla is the stock held by ARK Innovation ETF with the largest reported earnings and cash flow, but most of the money invested in the ETF, and thus in Tesla, came in at the exact peak. You can see this clearly on the above chart. Only a few investors were winners and the vast majority were heavy losers even in Tesla, which is currently the Ark Innovation ETF’s biggest winner.
Tesla is also among the ARKK stocks with the most rapid revenue growth and best fundamentals. It has both positive earnings and positive cash flow and has reasonable prospects for strong growth in revenues, earnings, and cash flow in the future. Despite a stock price that is down more than 30% from the high, it sells at a P/E ratio of about 80 and a P/FCF ratio of about 240. It has held up relatively well, but it remains extremely expensive. Nevertheless, if you wanted to take a flyer with any of the stocks held in ARKK (I don’t), Tesla would be one of the leading candidates.
An analogous company from the 1998-2000 dot.com Bubble and subsequent Crash would be Cisco Systems (CSCO) which rose to the #1 market cap of all US stocks and was the most heavily weighted stock in both the NASDAQ 100 and the S&P 500. Tesla is currently #5 in the S&P 500. Cisco continued to grow over the 22 years following the dot.com peak although revenue growth leveled off over the past decade. Cisco now sells at a P/E of 16.4. Its stock price has yet to regain its 2000 peak. Think about what happened to the capital of people who bought at the top in early 2000! That’s what investors did with Ark Innovations ETF. Here’s the chart of Cisco:
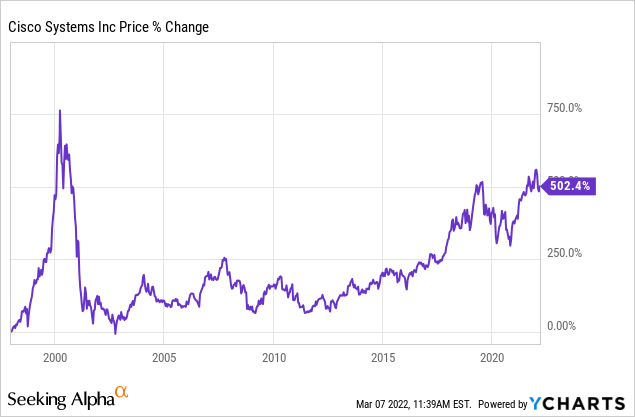
It would not be surprising if Tesla continued to succeed, though with gradually slowing growth, it may in two decades have a chart looking somewhat like that. The important thing to remember is that Cisco is one of the few winners which managed to maintain its growth to a reasonable degree. There are many popular stocks from the years leading up to the dot.com crash for which I cannot show charts because they no longer exist.
Seeking Alpha Factor Grades Take A Dim View Of ARKK But SA Analysts Are Divided
There are no surprises in the “Now” list although the D- Dividend Grade and the A grade for Asset Flows require some explanation. The Dividend Grade is based upon the $.78 disbursement of capital gains which occurred in late December of 2021. What it means is that ARKK sold more winners than losers in its portfolio and delivered a small amount of taxable cash return despite having a dreadful down year over all. It had a little over three times as much the previous year as reflected in return percentages (1.3% versus 4.13%): thus the movement of Dividend Grades from D- six months ago to A+ 3 months ago and back to D- Now. The short message: don’t expect much relief by way of Dividends.
The table below explains the marks for Asset Flows:
|
Asset Class Relative Grade |
ARKK |
Asset Class Median |
% Diff. to Asset Class |
|
|---|---|---|---|---|
|
AUM % Change 1M |
F |
-22.96% |
-5.64% |
NM |
|
AUM % Change 6M |
F |
-44.54% |
3.24% |
NM |
|
AUM % Change 1Y |
F |
-44.82% |
32.46% |
NM |
|
AUM % Change 3Y |
A |
819.07% |
89.38% |
816.34% |
|
Average Daily Share Volume 3M |
A+ |
21.95M |
40.47K |
54,150.19% |
|
Average Daily Dollar Volume 3M |
A+ |
1.70B |
2.48M |
68,355.25% |
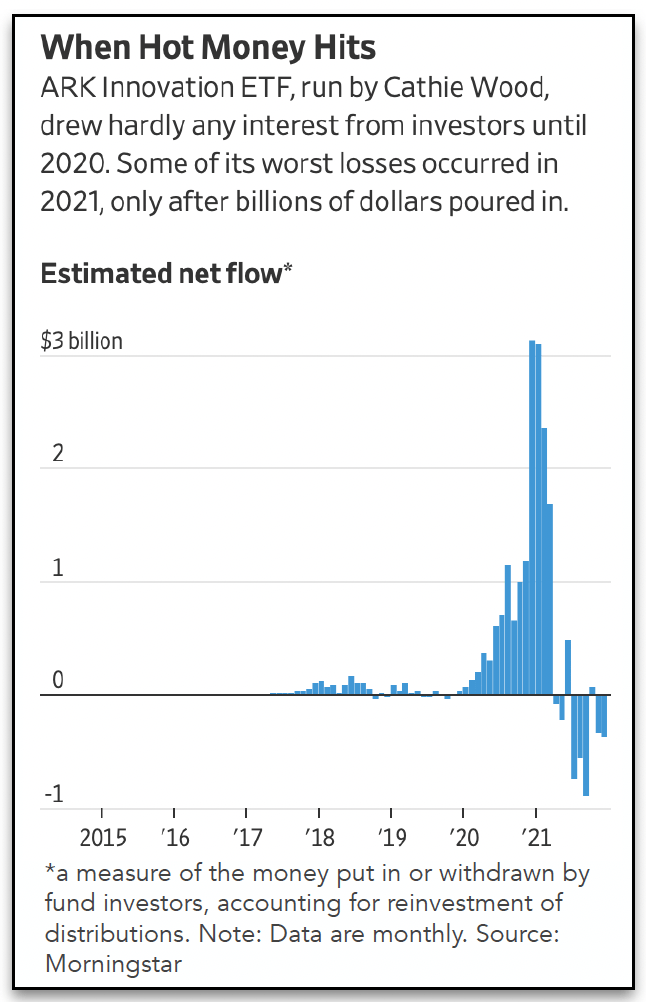
The explanation is there in the numbers. Assets under management have grown over the extended period of three years. Three years ago, as price was running up, a steep rate of increase in AUM was underway. As shareholders began to get out in 2021 the Assets Under Management began to fall and have fallen increasingly as the ETF Crashed. The details are in the charts and tables of the earlier section explaining how charts and a table tell an unfortunate story.
Long term Momentum still seemed wonderful 6 months ago but Crashed to a solid F on 3 and 6 month periods. Expenses are a straight F on all time frames. ARKK is an expensive ETF, period. Just note that its $.75 per share expenses equally its most recent capital gains return. ARKK’s risk is a straight F. The message is to get out of it at warp speed in a market which no is longer favorable to risk.
There is no Wall Street coverage of ARKK. The recommendations of SA writers are mixed to negative:
- Strong Buy: 0
- BuY: 6
- Hold: 4
- Sell: 8
- Strong Sell: 4
The current Buy recommendations on SA reflect the point of view of this article entitled “ARKK ETF: Performance Is So Bad It’s Starting To Look Bullish.” Read it to get a view which is the absolute opposite of mine. Of all the possible reasons to buy stocks this seems the weakest to me.
What Should You Do Now? Buy, Sell, Or Hold ARKK?
Of the individual stocks on the ARKK list of holdings I have written about just one, Shopify. In this article entitled “Shopify Stock Price Was Down About 50% in January; Should You Buy or Sell?” I was positive about the company but negative about the price. Shopify is actually a good business. I know about it in some detail because my wife uses it in her small business. I could not, however, recommend buying it at $666 on the day my article was published despite the fact it was down 62% from its all time high of $1763. It closed on the day I wrote this paragraph at a new low of $515, down another 22% from the time of that previous article and 70% from its high. I still can’t buy or recommend it because the valuation remains too high. The investors who bought Shopify anywhere near its all time high apparently paid zero attention to valuation. Growth was all that mattered. Any valuation was deemed fine for a fast-growing and sexy stock. That seems to have been the premise for the majority of ARKK holders who rushed in near the top.
So now what? The short answer is that for ARKK holders it’s a salvage operation, and not an easy one. There is no simple way to extricate yourself from a large loss. Your best loss is almost always your first loss. Sell when you notice erosion in your position which calls your initial premise into question. Once the cat is out of the box your options are limited. Whatever you do involves taking some lumps. This was one of the first hard lessons the market taught me many decades ago. What can I advise others to do? The only sure answer is to learn from your mistake and take care not to repeat it in the future.
It would not be surprising if the market for Cathie Wood stocks and the Ark Innovation ETF experienced a dead cat bounce. It doesn’t mean the position will turn around and go back anywhere near the all time high. What it may provide is an opportunity to get out of a mistake at a little better price. There’s no guarantee that you will get a bounce, however, and if you do get a bounce it’s anybody’s guess how high it will go or how long it will last. Whatever happens in the short run, there are strong odds that neither the Ark Innovation ETF nor the individual stocks it contains will go back to their previous highs any time soon. For a little over a year, since February 2021, the market as a whole has been in a stealth bear market. The speculative Cathie Wood stocks were among the first to crack. They were the leaders in the blowoff top and immediately flipped to become the first big losers on the downside.
The second group to crack were established growth stocks like the FANGs, or whatever they are called now, Amazon, Apple, Meta (FB). Netflix (NFLX), etc – the stalwarts of the NASDAQ 100 (QQQ). If this proves to be a full-fledged bear market the last to decline will be the stocks in the more conservative S&P 500 (SPY). The chart above showing ARKK, SPY, and QQQ give a clear visual representation of the order in which the market turned. A key point to note is that ARK Innovation ETF, a good proxy for the riskiest part of the market, is down 60% from the top, while the other indexes have recently been down about 10%. This suggest the degree to which the holdings in ARKK were overpriced as compared to other growth stocks.
Many investors have a long enough memory to recall that it worked exactly that way in 2000-2003. The dot.com stocks broke first and hardest, and many disappeared never to rise again. More solid growth leaders were hit hard but most eventually came back to some degree like Cisco. Value stocks like Berkshire Hathaway (BRK.A)(BRK.B) suffered a brief and shallow decline and then rallied quickly to new highs and kept on rallying for the rest of the decade.
Most investors probably don’t recall the inflationary bear market of the 1970s in which the speculative stocks which often found an excuse to insert the word “electronics” into their names rallied to absurd heights and then crashed the hardest. Many of them never recovered. The Blue Chip one-decision stocks like Coca-Cola (KO) and Johnson & Johnson (JNJ) also rallied to absurd multiples. A famous study by Jeremy Siegel, in support of his book Stocks For The Long Run, showed that if you had the tenacity to hold on to around the year 2000 you did fine. Value stocks, again, did better because less overpriced to start with. Every era repeats the past, but every era is to some degree different.
If there is a single factor that punctured the current bubble in hyper-expensive hyper-growth stocks it was the realization that much higher interest rates were on the way to counteract rising inflation. Stocks like the ones in the long list above have strong top line growth but the majority lack positive current earnings or cash flow. They may or may not have bright futures but the kind of cash flow which will reward shareholders is far into the future. The value of an income stream must be discounted into the future using a denominator that goes in a series starting at 1 for immediate cash flow, (1+D) after a year, (1+D) squared for year 2, out to (1+D) to the N power. D is the discounting factor and N the number of years. It’s obvious that a jump in the discounting rate severely damages the value of hyper growth companies which have most of their earnings and cash flow in the future. No single fact better explains the bifurcation in the present market in which stocks with immediate solid earnings are performing better than growth stocks.
ARKK has been a disaster for beginner investors. The fabulous growth rates of some of its stocks were too hard to resist. Many were inflated as businesses which came to the fore during the pandemic lock down. Inexperienced investors projected their growth rates far into the future. The hard thing for many investors to accept at this point is that despite their severe decline most of these companies are still not cheap. Cathie Wood recently referred to her portfolio as “value stocks,” but that is one thing they most certainly are not. They are best described as “broken stocks,” and broken stocks rarely make quick comebacks. It’s undeniable that the price earnings ratios of the stocks in the ARKK portfolio have come down from their peak, but it’s still hard to make an argument that valuation of the stocks in ARKK makes much sense.
There’s really no satisfying answer to the buy, sell, or hold question. A few of the stocks owned by Ark Innovation ETF will probably succeed and resemble the one-decision stocks from 1970 which did well if you held them for three decades. But which? And are you prepared to wait that long? For the group as a whole you are stuck with the comic Will Rogers suggestion, “Buy stocks. When they go up, sell. If they don’t go up, don’t buy.” The term Hold is probably the least helpful of all advice. It reveals little except a lack of enthusiasm. I won’t go there. It’s too late to rush for the exits. It’s too early to think of buying. Be deliberate. The practical suggestion is to use some skill and some judgment and look for a bounce to get out of your position.
Credit: Source link