


The Bitcoin (BTC) price failed to reach a new yearly high while the Crypto Market Cap (TOTALCAP) was successful. Quant (QNT) broke out from a long-term resistance area.
In the news today:
TOTALCAP Reaches New Yearly High
The cryptocurrency market cap has increased alongside an ascending support trend line since October. More recently, it bounced on the trend line on December 18 (green icon) and began an upward trend. This led to a new yearly high of $1.65 trillion yesterday.
The upward movement caused a breakout above the $1.60 trillion resistance area, now likely to provide support. $1.60 trillion is both a horizontal area and the 0.382 Fib retracement resistance level.
However, the RSI is showing some bearish signs. Market traders use the RSI as a momentum indicator to identify overbought or oversold conditions and to decide whether to accumulate or sell an asset. Readings above 50 and an upward trend indicate that bulls still have an advantage, whereas readings below 50 suggest the opposite.
Even though the RSI is increasing and above 50, it has generated a bearish divergence (green). A bearish divergence occurs when a momentum decrease accompanies an increase in value.
Nevertheless, the trend can be considered bullish if TOTALCAP does not close below $1.60 trillion. The next resistance is 15% above the current level of $1.87 trillion.
Despite this bullish TOTALCAP prediction, a breakdown from the ascending support trend line will likely lead to a fall of 13% to the 0.382 Fib retracement support level at $1.41 trillion.
Read More: 7 Must-Have Cryptocurrencies for Your Portfolio Before the Next Bull Run
Bitcoin Fails to Reach Yearly High
Like TOTALCAP, the BTC price has increased alongside an ascending support trend line since October. Unlike TOTALCAP, the BTC price did not reach a new yearly high. Rather, it created a lower high on December 22 and has fallen.
Also, the price is trading inside an ascending parallel channel—often considered a corrective pattern. BTC currently trades at the long-term ascending support trend line.
If BTC breaks down, it can fall by 14% to the 0.382 Fib retracement support at $37,200.
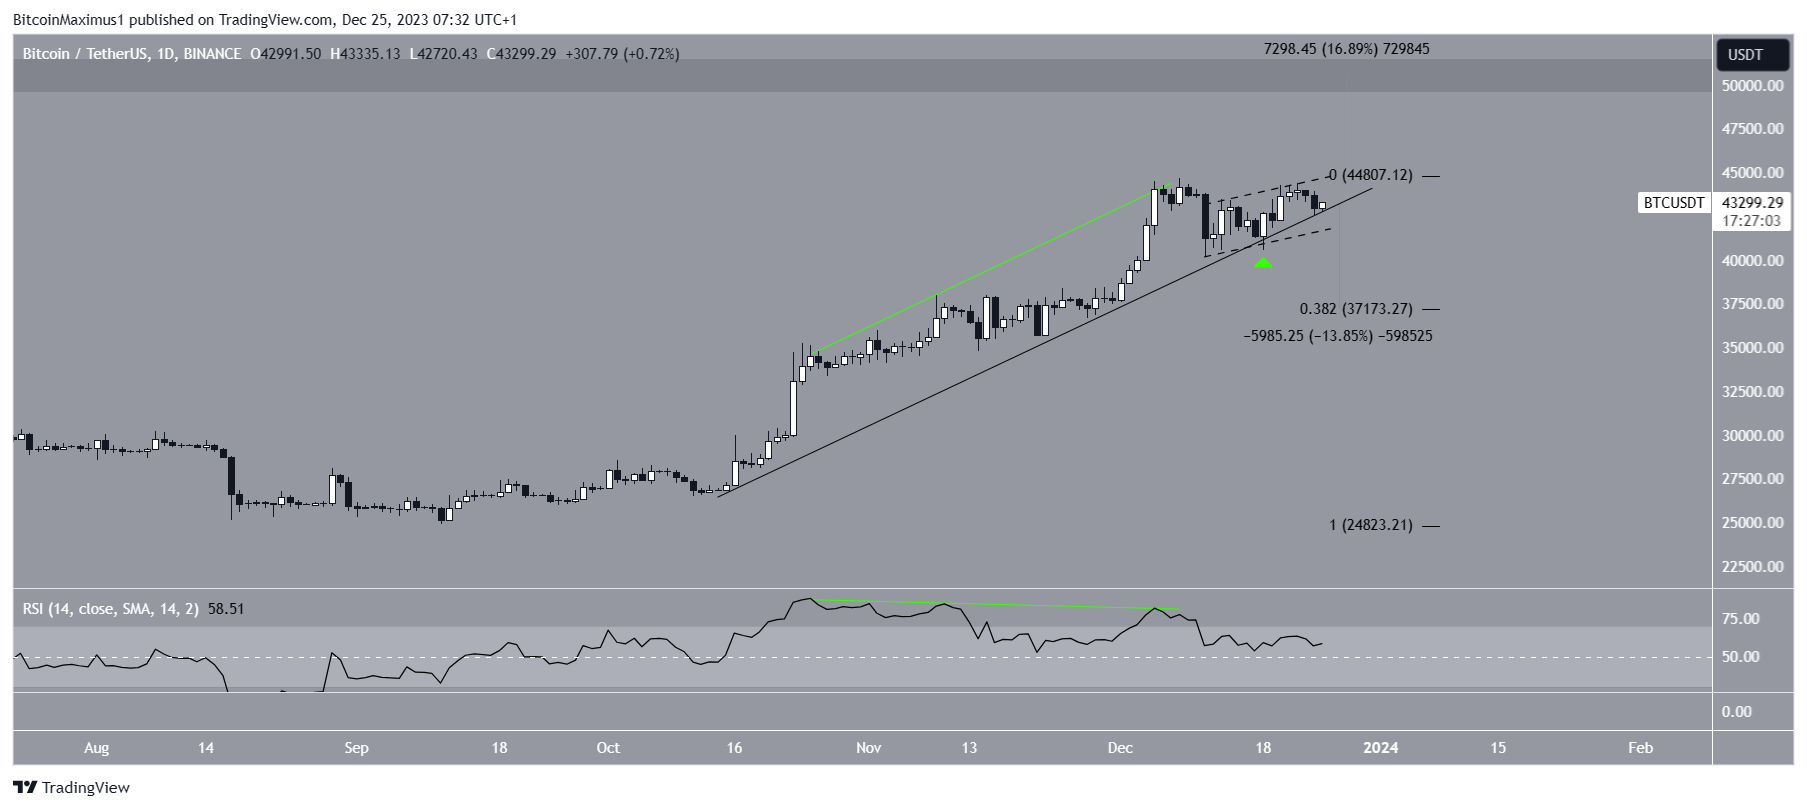
On the other hand, a bounce at the support trend line and breakout from the channel can trigger a 17% increase to the next resistance at $50,000.
Read More: 9 Best Crypto Demo Accounts For Trading
QNT Accelerates Rate of Increase
The QNT price has increased since breaking out from a descending resistance trend line on October 22. Initially, the price was rejected by the $118 resistance area on December 9 (red icon).
However, it regained its footing yesterday, creating a large bullish candlestick and breaking out from the resistance area. The price reached a high of $145 today.
If the upward movement continues, QNT can increase by another 15% and reach the next resistance at $160.
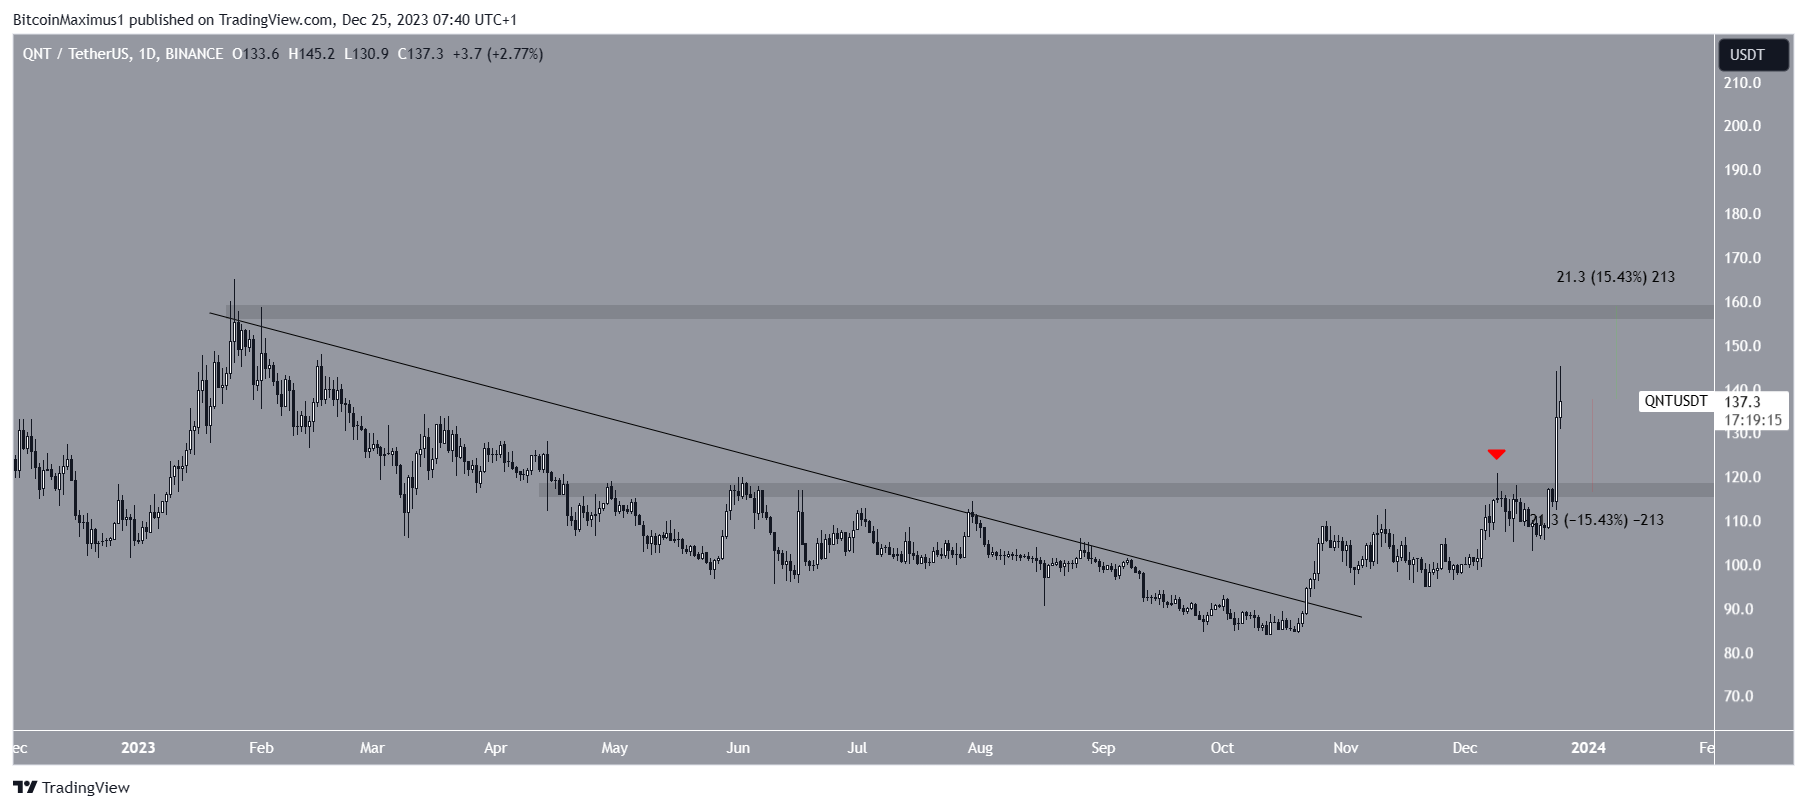
Despite this bullish QNT price prediction, failure to sustain the increase can trigger a 15% drop back to the $118 horizontal area.
For BeInCrypto‘s latest crypto market analysis, click here.
Read More: Best Upcoming Airdrops in 2023
Disclaimer
In line with the Trust Project guidelines, this price analysis article is for informational purposes only and should not be considered financial or investment advice. BeInCrypto is committed to accurate, unbiased reporting, but market conditions are subject to change without notice. Always conduct your own research and consult with a professional before making any financial decisions. Please note that our Terms and Conditions, Privacy Policy, and Disclaimers have been updated.


