


Continuing the bear trend in 2023, SHIB price is down by 7.64% in a YTD calculation. Moreover, the Shiba Inu prices are trading at a discount of 91.65% from its all-time high of $0.00008854. Failing to lead a golden cross, the SHIB prices revert from the 50-day EMA and prolong the ongoing trend.
With the 50 and 200-day EMA trending lower, the SHIB price action displays a bearish pattern breakout. Will this breakout rally drop Shiba Inu prices by 10% this month?

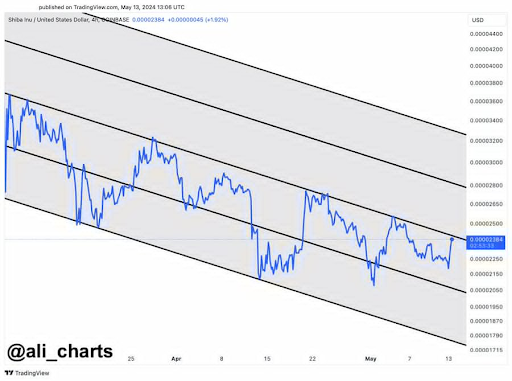
Maintaining the triangle pattern last month, the SHIB prices broke below the support trendline on the last day. Leading to not just a triangle but also a bearish pennant breakdown, signaling a drop in Shiba Inu market value.
Creating bearish candles for the last six days, the SHIB prices are down by 10% and trade at $0.00000752. The sudden supply influx at the 23.60% Fibonacci level and the 50-day EMA confluence prove catastrophic for the meme coin.
Coming to the technical indicators, the MACD and RSI indicators display an increase in bearishness. The MACD and signal lines continue the downtrend after failing a positive crossover. Meanwhile, the RSI line approaches the oversold boundary.
Will Shiba Inu (SHIB) Price Avoid A New 2023 Low Formation?
With the ongoing downtrend gaining momentum, the next key support levels for Shiba Inu prices are far away. The SHIB prices may find a reversal spot at $0.0000070 or $0.0000065. However, if the market fails to find any catalyst before the SEC decides on Bitcoin ETF in October, the meme coin is set to find new bottom supports.
On a positive note, if the SHIB price manages to break above the 50-day EMA, it may resurface above $0.0000090. Moreover, the recovery rally can pump Shiba Inu drastically to potentially reach the overhead resistance of $0.000010.
Credit: Source link


