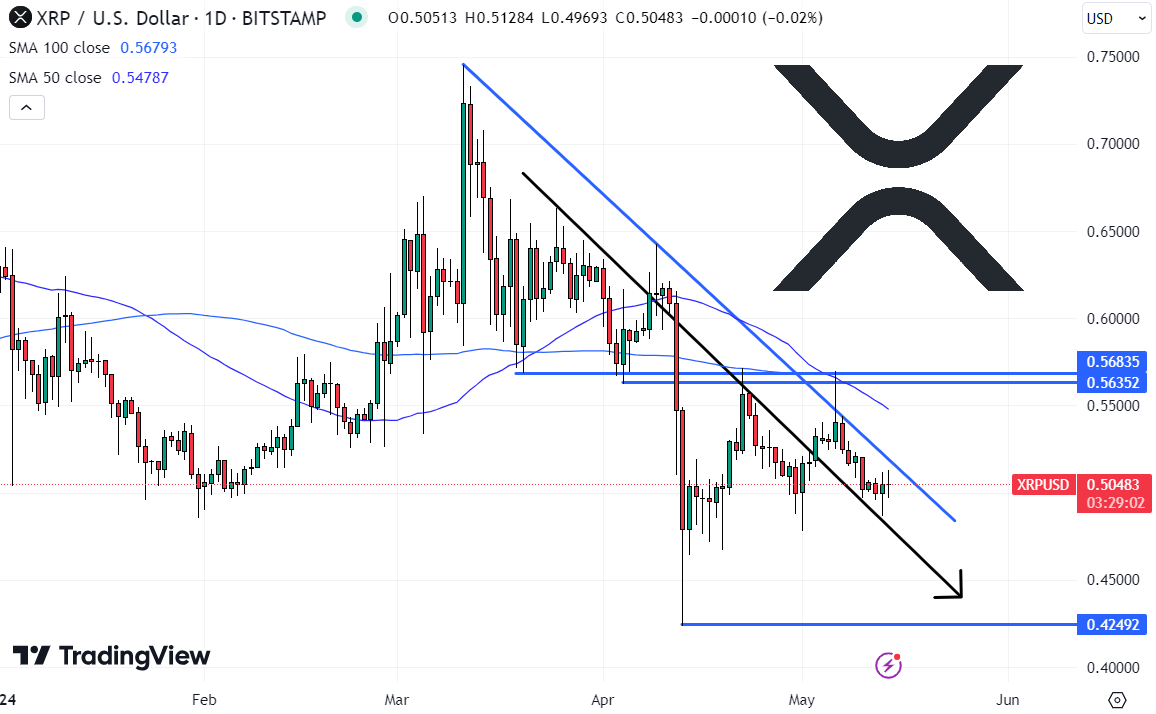
- Ripple faces resistance at the descending trendline and $0.6.
- Declines may come into the picture if the 50 SMA support in the 4-hour chart breaks.
Ripple struggles to hold above the short-term support at $0.55 following a failed attempt to touch $0.6. A descending trendline has capped the immediate upside on the 4-hour chart. XRP is doddering at $0.56 at the time of writing.

The bearish momentum appears to be building while declines beckon toward $0.5. Note that the 50 Simple Moving Average (SMA) is in line to offer support and prevent losses eyeing $0.5 and $0.45, respectively.
In the meantime, the Moving Average Convergence Divergence (MACD) shows a consolidation move could take precedence in the near term. The MACD is horizontal within the positive region, hence the bullish inclination. Ripple will remain in the no-trade zone if technical levels remain unchanged.
On the upside, a break above the descending trendline would see bulls shift the focus to $0.6. Similarly, the price action above this level could be massive due to speculation bound to rise. Recently, XRP tested the seller congestion at $0.65, which, if broken, may elevate the cross-border token toward $0.75.
XRP/USD 4-hour chart

On the downside, losses will extend to the support highlighted by the 100 SMA at $0.5 but may stretch to $0.45. It is essential to wait for a confirmed breakout or breakout before increase or decreasing your XRP position. In other words, trades must be aware of the ongoing sideways trading.

Ripple intraday levels
Spot rate: $0.56
Trend: Sideways trading
Volatility: Low
Support: 50 SMA on the 4-hour chart, $0.5 and $0.45
Resistance: $0.6 and $0.65
To keep track of DeFi updates in real time, check out our DeFi news feed Here.