- XRP after the most awaited bull run is currently trading under the symmetrical triangle pattern, moving positively with the gain +1.42% at $0.6150
- The pair of XRP/BTC, however, trading negative with the intraday loss of -3.25% standing at 0.00003303 BTC
XRP over the monthly chart gains the momentum from the lower level of $0.2465 and makes the new 52-week high of $0.7680, however, gets corrected from the high and tests the lower level of $0.4621. The price gets recovered after making low and currently trading with respect to the rising support line indicating the bullish momentum of XRP. Over the 4-hours time frame, the coin is trading in the symmetrical triangle pattern heading for the breakout in coming trading sessions.
The 50-day ($0.5775) moving average will act as the support for the short term after the positive crossover of 50-days by the 9 and 21-days moving average built-up bullish momentum for XRP, however, last time the line of 9-day moving average suppresses the 21-day MA again built-up again positive crossover for the short term. The resistance over the monthly chart is at $0.7680 and $0.800 while on the support is placed at $0.4700 and $0.300 act as the strong support.
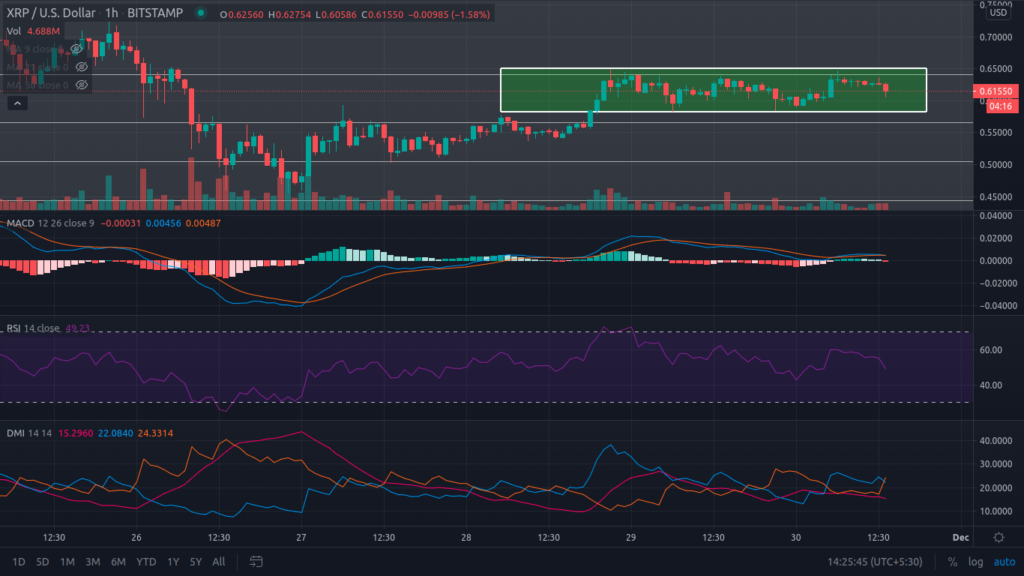
The daily chart of XRP is indicating the consolidation in the minor range of $0.5820 and $0.6495, trading with no clean momentum, in today’s trading session XRP is trading at the price level of $0.6151 with the minor correction of -2.03%, supported by the volume recorded in the last 24-hours of $15,165,827,754 and the total market capitalization of $27,820,502,440. Finds the support at the price level of $0.5820 while the resistance on the higher side is placed at $0.6375.
The Relative Strength Index (RSI) is heading towards the oversold zone indicating the bearish momentum for the short term and the level of RSI is 44.95.
Directional Movement Index (DMI) the -DI line is heading towards the +DI line to suppress it indicating the bearish momentum in the short term and while ADX line is moving with -DI.
Moving Average Convergence Divergence (MACD) gives a mixed signal as trading overlaps the Bull’s line (blue) with Bear’s line (red) indicating the consolidation at this price level with more significance of Bear’s line.
Resistance levels: $0.7680 and $0.800
Support levels: $0.4700 and $0.300