
- Xrp price is trying to rebound after testing its strong demand or support zone, while bullish momentum is heading towards the 20-day moving average hurdle.
- The crypto asset is trading below all major moving averages of 20, 50, 100, and 200-day, whereas 20-DMA acts as a short-term resistance line.
- The pair of XRP/BTC is trading on a bullish note at 0.00001846 BTC with an intraday gain of +2.84%, and the ratio of XRP/ETH is CAMP flat at 0.0002904 ETH with a slight growth of +0.57%
After a sharp downtrend, XRP price is trying to rebound from its strong demand or support zone. In contrast, the crypto asset is now trying to recover but facing a strong hurdle of 20-DMA.
XRP token is now trading near its substantial hurdle of 20-day moving averages, while volume is slightly lower. Volume over the monthly chart is lower, which falls below the average line and needs to improve in upcoming trading sessions. Once, XRP token started to sustain above 20 and 50-DMA with supportive volume action, pushing more buyers in forthcoming trading sessions. Support on the lower side is at $0.51 and $0.44, whereas resistance on the higher side is $0.72 and $0.81.
XRP price over the weekly chart is trading strongly from the lower levels
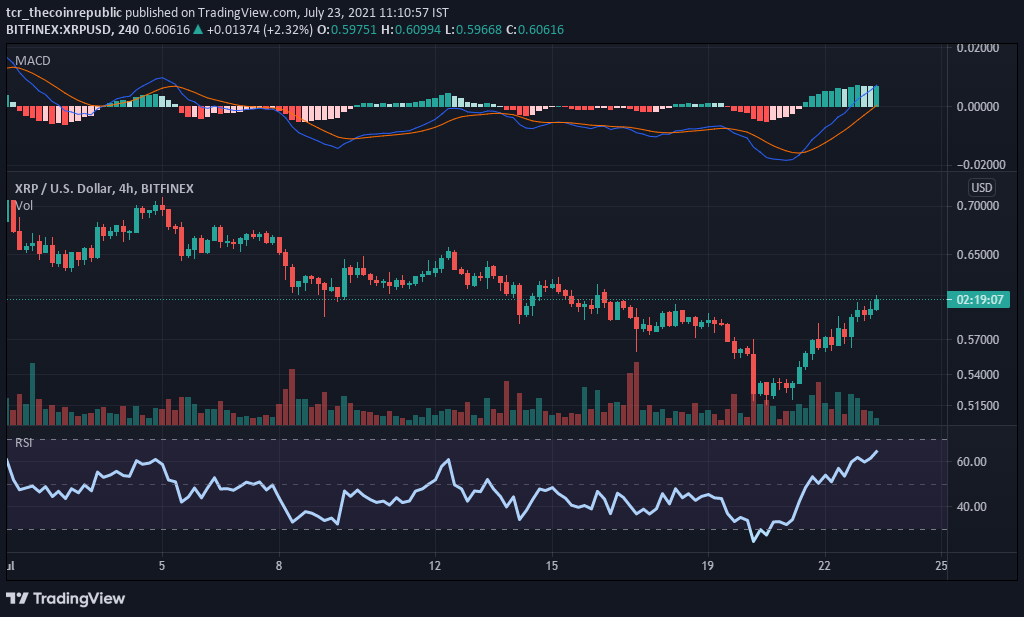
XRP price over the weekly chart is trading on bullish or recovery notes while gains strongly from the lower levels. Whereas, at the 4-hour time frame, the coin is trading on a bullish note and heading towards the higher levels. The technical parameters are running higher or overbought zone after testing the oversold zone. Presently, XRP is trading at $0.60 with an intraday gain of +6.14%, and the volume to market cap ratio is at 0.09204.
Relative Strength Index (Bullish): XRP price RSI presently indicates a bullish or positive trend over the weekly chart. In contrast, the RSI is trying to rebound after testing the oversold zone and now heading higher CMP 64.
Moving Average Convergence Divergence (Bullish) currently indicates a positive or bullish trend on the daily chart. This is because the buyer’s signal line (green) overlaps the seller’s line (red).
Support levels: $0.51 and $0.44
Resistance levels: $0.72 and $0.81.
Credit: Source link