- XRP coin price is trading near the crucial support of 200-DMA while facing the temporary resistance of 20-day short term moving average (SMA)
- The digital asset is placed near the vital moving average of 200-DMA; whereas, the technical structure is also looking good above 200-DMA
- The pair of XRP/BTC is trading with minor gains of +0.43% at 0.00002207 BTC; similarly, the ratio of XRP/ETH is CMP at 0.0003546 ETH with 24-hours gains of +0.16%
XRP coin price is trading near the narrow zone of 200 and 20-Day moving average. In contrast, breakout on either side will give a boost to momentum. The digital asset is trading near the vital support of 200-DMA, while Bulls are comfortably managing the token above the 200-DMA support. At the same time, the cryptocurrency is facing strong rejection of the 20-day short term moving average, also acting as a resistance line.
Volume over the monthly chart slips below the average line, and it needs to improve for a positive breakout in the upcoming trading session. Ripple needs to hold the major support of 200-DMA and the volume and needs to improve for bullish momentum. Support on the lower side is at $0.78 and $0.65, whereas resistance on the higher side is $0.99 and $1.25.
XRP Coin Price Forming Bearish Chart Structure
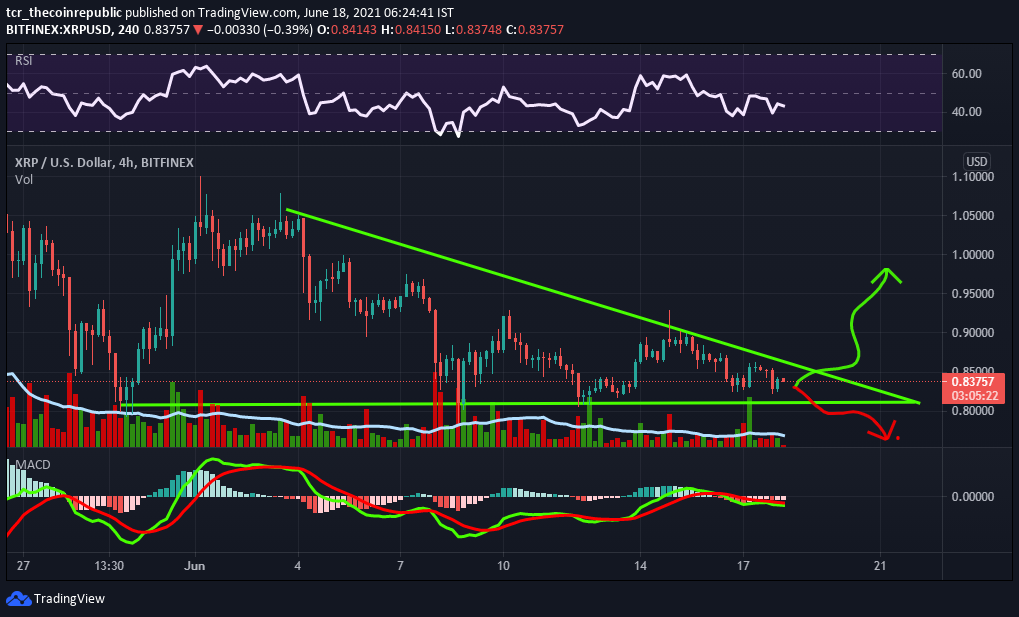
XRP coin price over the weekly time frame is forming the bearish chart structure of descending triangle pattern. Meanwhile, the token is gradually heading towards the edge of the pattern, and soon we can expect a sharp move. Moreover, the technical parameters are given mixed signals, but the pattern indicates the bear’s bias. Currently, the coin is trading at $0.83 with an intraday loss of -2.10%, and the volume to market cap ratio is at 0.06801.
Relative Strength Index (BEARISH): XRP coin price RSI is presently projecting bearish momentum, gradually heading towards the oversold region over the weekly chart. At the same time, trading at 42 levels.
Moving Average Convergence Divergence (BEARISH): Currently projecting a downtrend over the weekly chart. The MACD shows the seller’s line (red) is overpowering the buyer’s signal line (green).
Support levels: $0.78 and $0.65
Resistance levels: $0.99 and $1.25
Get this news hand-delivered to you on Telegram. Join our Telegram for similar News and Information related to CRYPTOCURRENCY, BITCOIN, BLOCKCHAIN NEWS, and Price prediction.