- XRP price broke out of an ascending triangle jumping by 12%.
- Several indicators show XRP could be on the verge of a correction in the short-term.
XRP had a notable breakout on November 13 from the ascending triangle pattern formed on the daily chart. The initial price target is $0.30; however, the digital asset could be looking for a pullback first.
XRP facing strong selling pressure despite breakout
Using the height of the ascending triangle as a reference, the bullish price target would be $0.30 on the daily chart. XRP price peaked at $0.289 which is extremely close to the goal. Now, the digital asset is facing some selling pressure from a sell signal.
XRP/USD 12-hour chart
On the 12-hour chart the TD Sequential indicator has presented a sell signal which has often led XRP price to retrace significantly over the next few days. In addition to the signal, the RSI is also overextended, adding even more selling pressure. The bear price target would be $0.25 which coincides with both the 50-SMA and the 100-SMA.
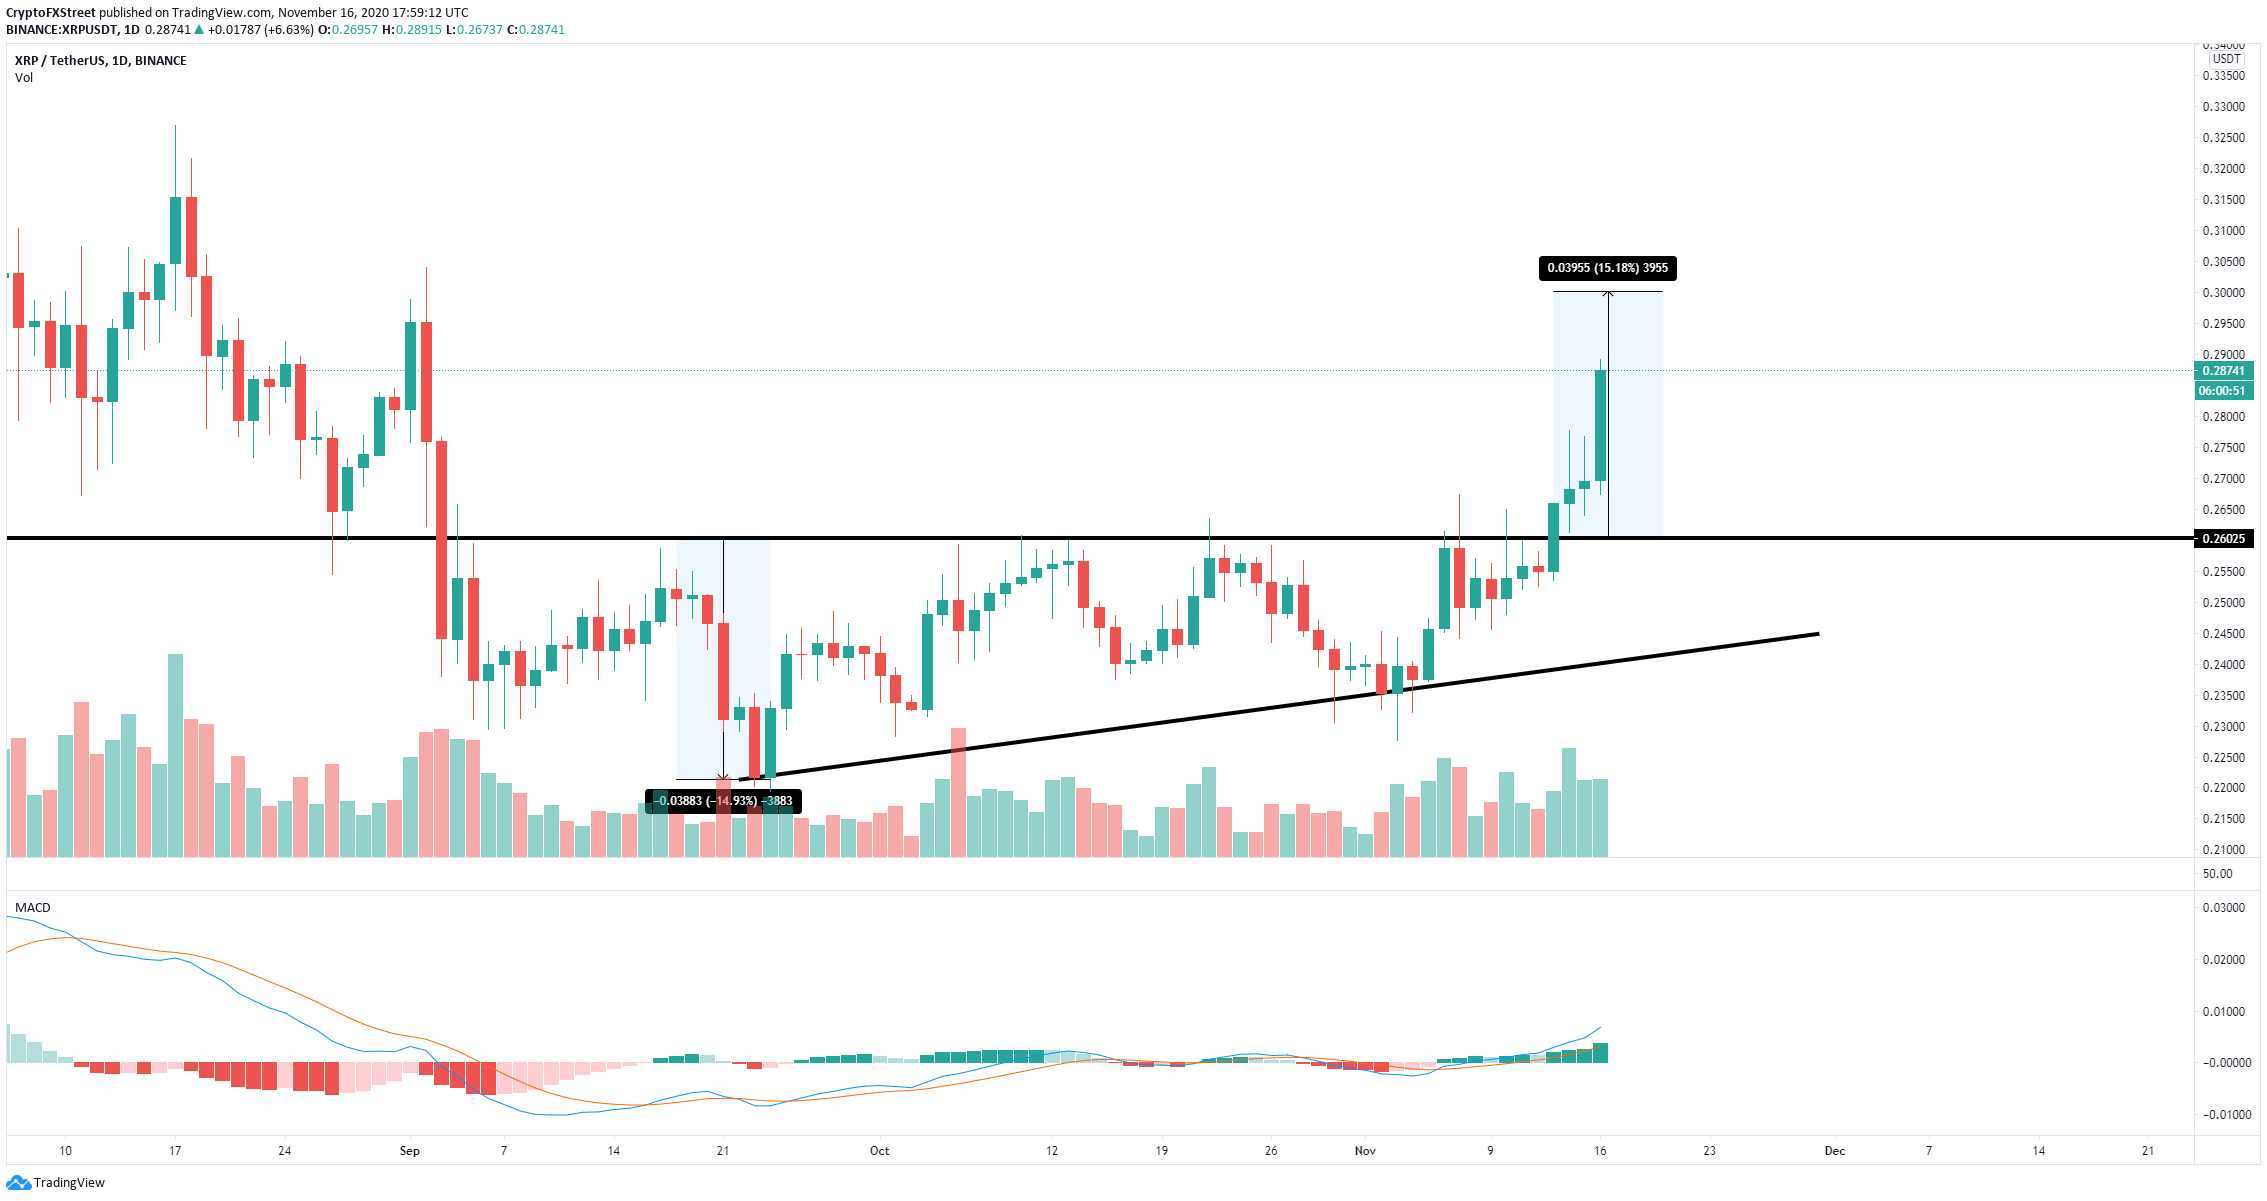
XRP/USD daily chart
However, despite the sell signal, XRP is still aiming for the $0.30 price target on the daily chart after the breakout from the ascending triangle. The MACD is not only bullish but gaining strength, indicating that bulls still have more fuel.