- XRP price finally climbed above $0.30 for the first time since September.
- The TD Sequential has presented a sell signal on the 4-hour chart.
It seems that XRP is finally catching up to the crypto market after a notable rise to $0.30 for the first time in two months. Unfortunately, several indicators have turned bearish for XPR, showing a potential short-term pullback is lurking around.
XRP at risk of retracing in the short-term
On the 4-hour chart, the TD Sequential indicator has presented a sell signal which coincides with an extremely overextended RSI level. The last sell signal also coincided with an overbought RSI and was validated shortly after.
XRP/USD 4-hour chart
Validation of the current sell signal could drive XRP price towards the next support level which seems to be around $0.268, coinciding with the 50-SMA. Additionally, on the daily chart, XRP price was just rejected from a critical resistance level.
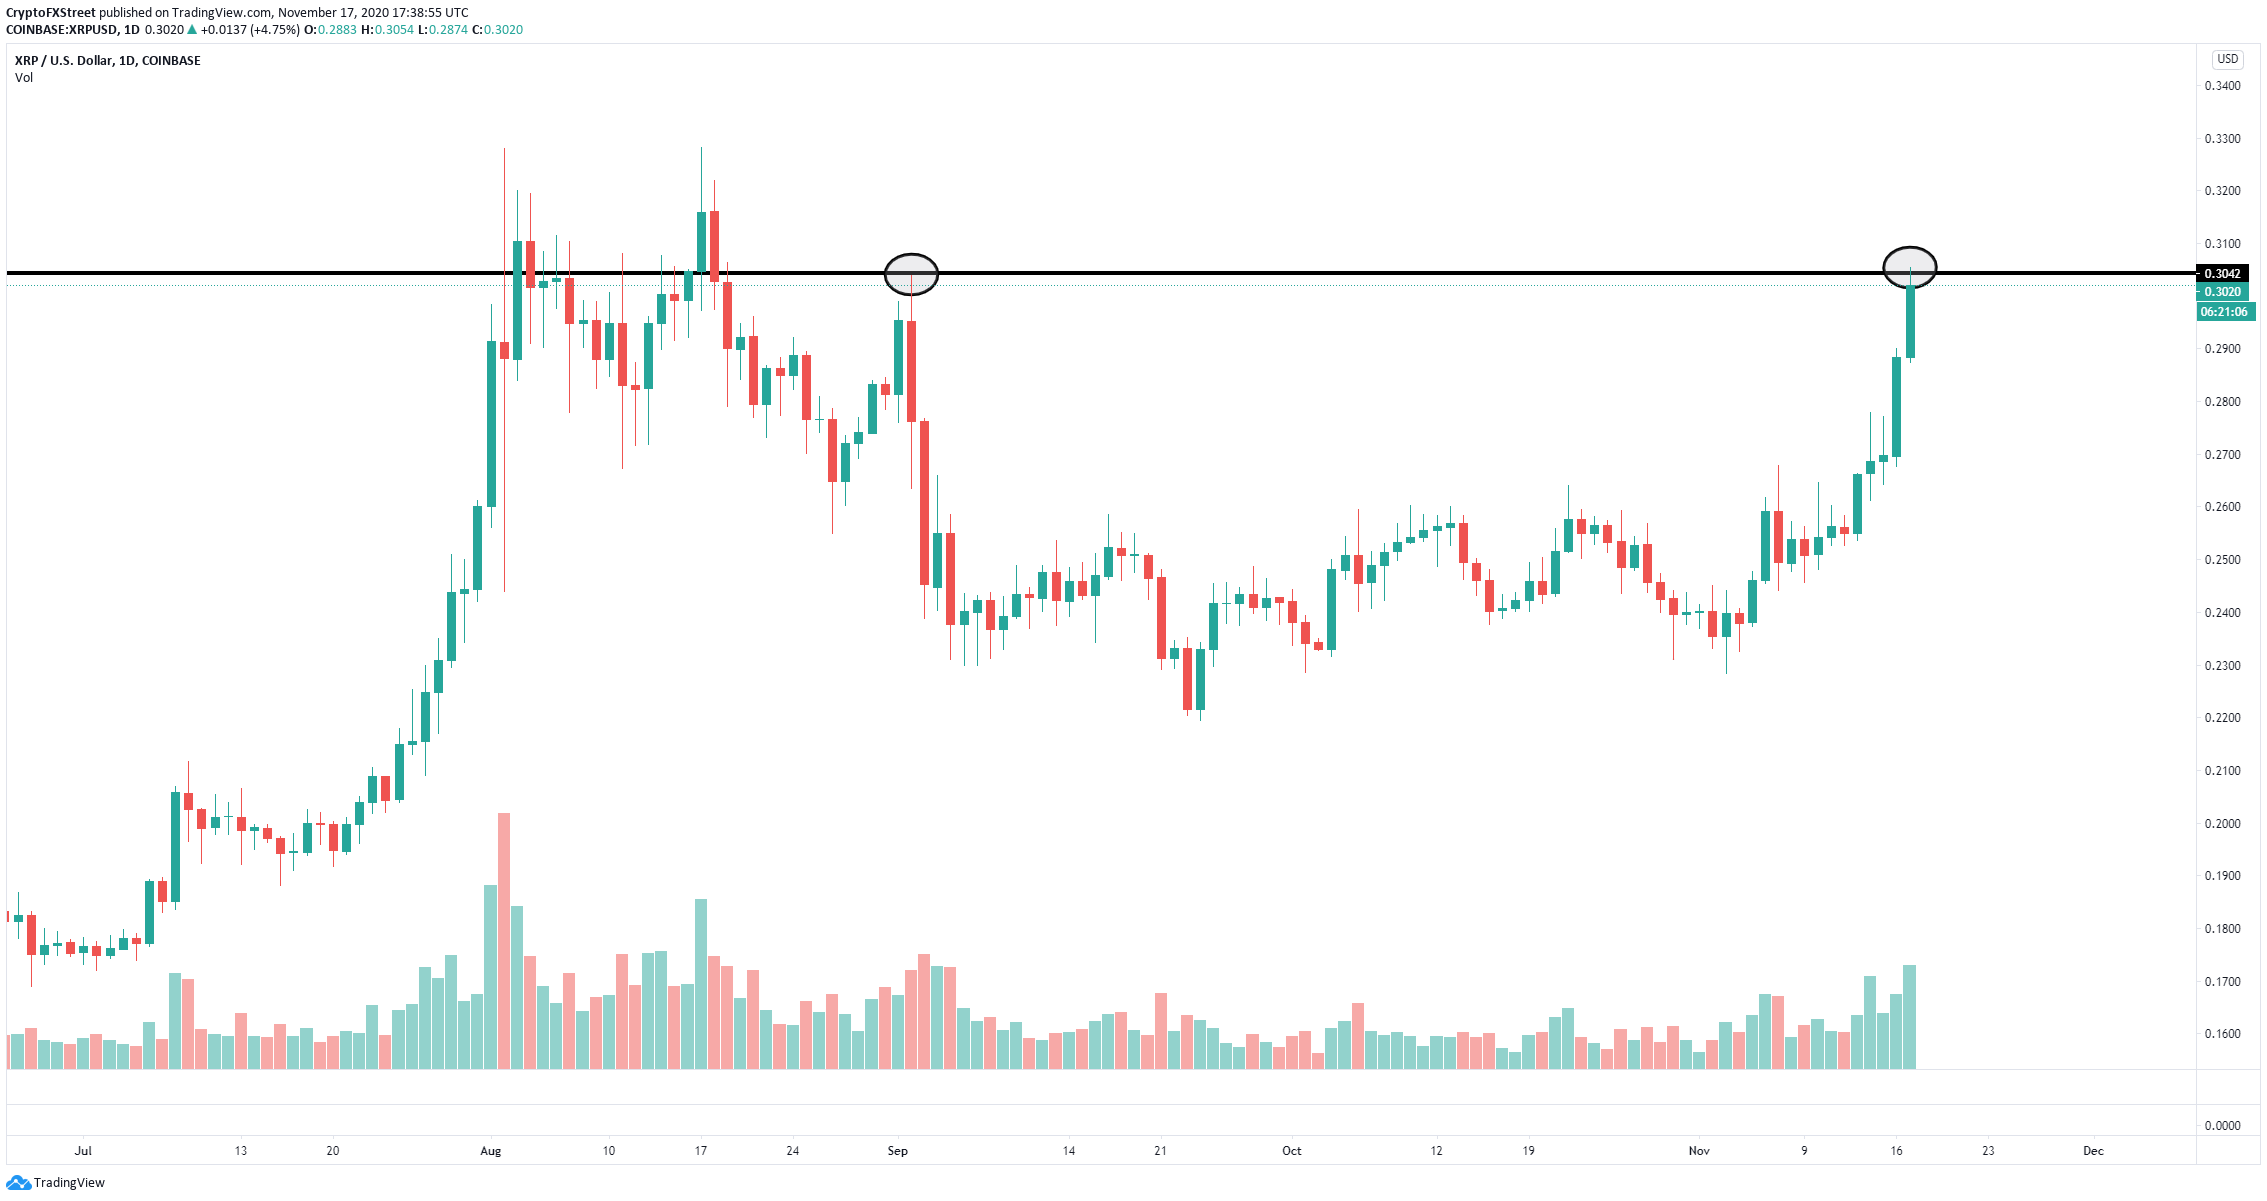
XRP/USD daily chart
The $0.304 resistance level was formed on September 2 when XRP price got rejected significantly, losing 21% within 48 hours. Another rejection could be just as devastating as the digital asset seems to have very little support on the way down.
However, a breakout and close above this point would be notable and can quickly drive XRP price towards the 2020-high at $0.328. The trading volume of XRP has been increasing since November 13, adding more strength to the bullish outlook.