Ripple(XRP) prices broke out of the Ascending parallel pattern and signalled a bullish trend on March 22, 2021. However, selling pressure seems to have taken over Ripple’s currency. The consolidation phase has returned before the XRP could make bold moves.

XRP Price Analysis
Decent transaction volumes worth $5.42 Billion have taken place in the last 24-hours, according to CoinMarketCap. But it was 55.98% lesser than that of the previous trading session. Experts suggest that if XRP does not dump in two trading sessions, there is potential to break the multiple resistances at $0.59 and $0.6 and fly above $0.65. XRP’s market cap stood at $25,190,238,817 after decreasing by 4.84% in the last 24 hours.
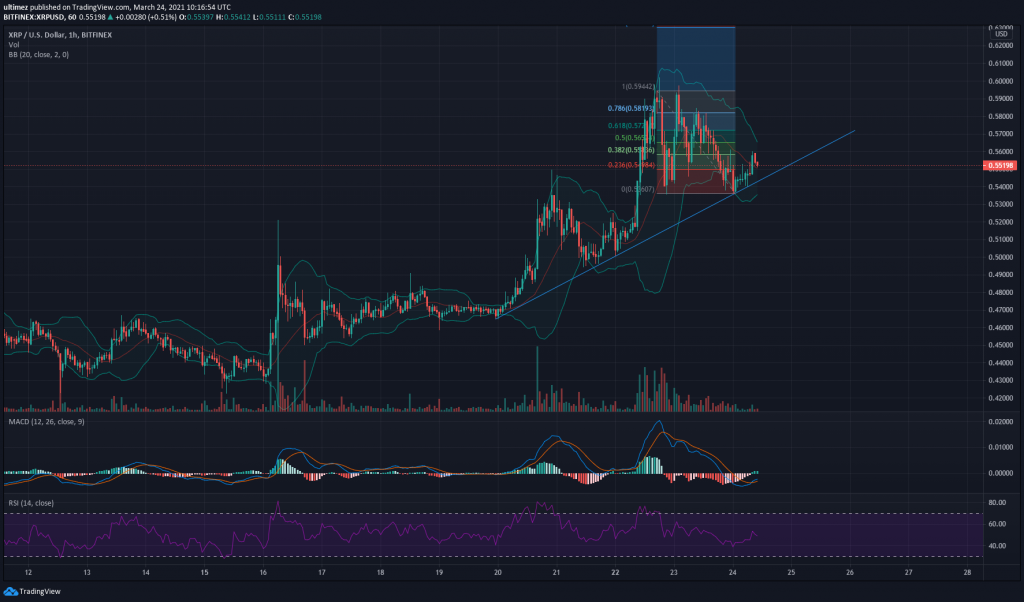
Ripple(XRP) has held its prices above the trend line, consolidating over $0.54 levels. One hour candle chart trendline shows the currency still in bullish momentum. A single trading session with a good buying spree could elevate the XRP to $0.8 or above.
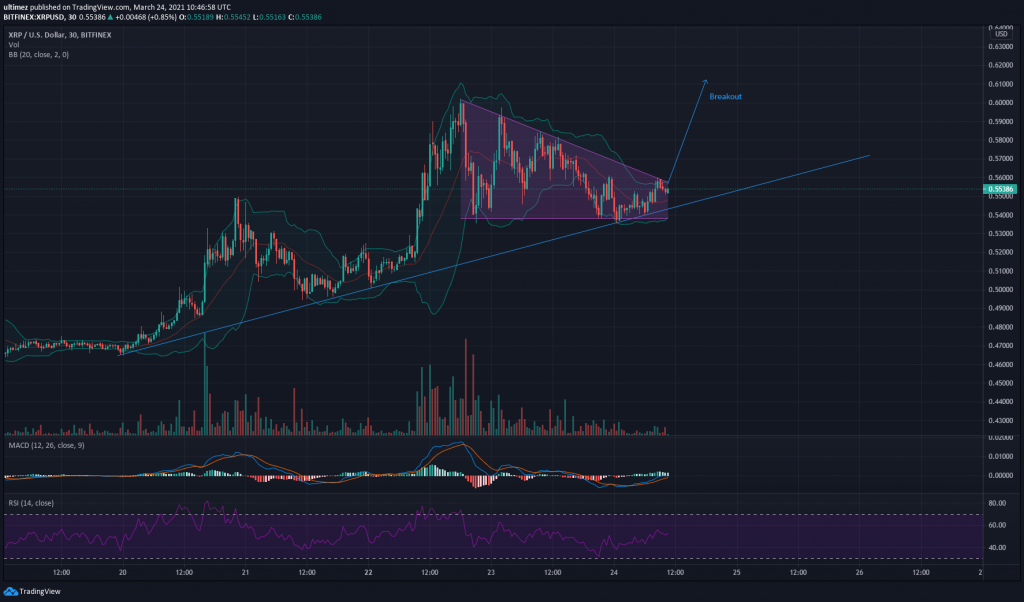
When switched to 30 Minute candle chart, the pennon pattern with a Flat bottom trendline, acting as a resistance zone. This signifies Bullish momentum, and the Bollinger band supports the reasoning by narrow difference at the neck.
XRP was trading at $0.5555, down 4.84% at the time of penning this article. Even the EMA, MACD indicates bullish momentum.
The Bollinger Bands indicate price alignment with the upper Bollinger band and even crossed it, strengthening the possibility of another breakout targeting $1 shortly.
The RSI levels are at 50 and pivoting around the same. Although the RSI indicator is calculated for 14 days generally, sufficient volumes are being held by investors. The Bitcoin volatility and a dump could attract the investors towards Ripple(XRP).
Looking at the Fibo charts, Ripple has sustained well at 0.36 and above. The tool suggests that the targets could be set to $0.8 and above if the resistance levels at .5 get broken and selling pressure decreases.
Resistance levels: $0.57, $0.6
Support Levels: $0.54, $0.52
MACD: Bullish
RSI(14): 50