XRP price – Polkadot Analysis- DOT price Breaks Resistance $39.08, Targeting $50?


The year 2021 has been extremely bullish with regards to Cryptomarkets. Many cryptocurrencies from BTC, ETH, DOT to XRP & FIL have had a bull run breaking record levels to create ATHs. Polkadot, which aims for Blockchain Interoperability, has become the sixth-largest cryptocurrency by market share in a short period.

In February, DOT price recorded a lifetime high of $42.28, rising from $18 levels and since then has been consolidating. The consolidation phase was anticipated as the retailer investors booked their profits. This was followed by the trading sessions where the prices tried breaking resistance levels of $38.5 multiple times but faced rejections.
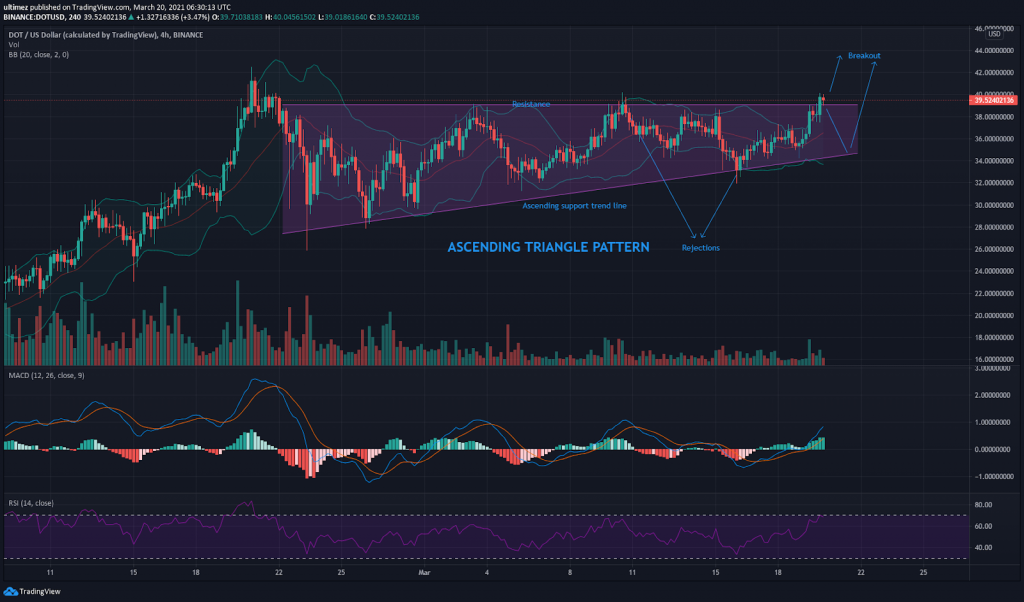
The rejections at higher highs could not send the prices below $30, which acted as strong support. The prices were slowly pushed, and an ascending triangle pattern has formed, indicating a strong trend in the upcoming sessions. The percentage of uptrend is higher, studying the markets and the rejections at higher lows.
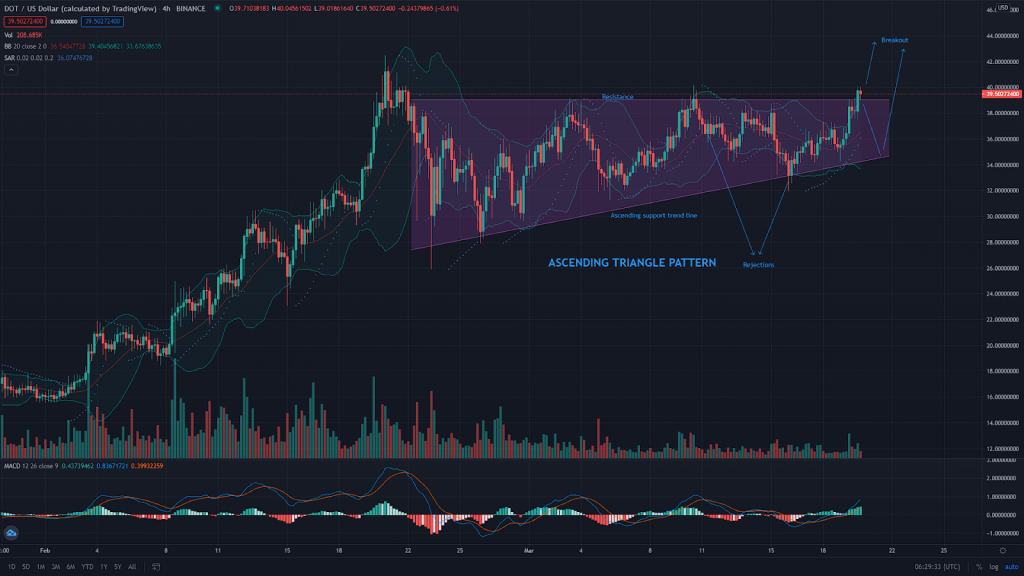
A four-hour candle chart revealed the breakout of price over the resistance level of $39.02, but it is to be seen if it can hold above the level. There is a chance of a sudden price rise breaking the ATH. But another strong possibility is a minor consolidation and then blasting over the ATH. We can expect the $50 targets if price action dominates DOT prices.
At the time of this analysis, the price was pivoting near the $39 mark with 9% returns in 24 hours. DOT boasts a market capital of $35,960,458,760 and the sudden increase in the volume of Polkadot of above 80% in trading volumes, with the value reaching $2,812,834,331 in just the last 24 hours.
DOT price Forecast
With increased trading volumes, it is almost certain that prices will break the ascending triangle. 921,917,768 DOT are in circulation, out of 1,057,877,435 DOT, indicating that the markets are more active than ever.
MACD levels indicate bullishness along with the parabolic SAR. RSI levels are closing 65 indicating a buying sentiment. The prices are holding up above the upper levels of the Bollinger band if they sustain at the same levels for a couple more trading sessions and no selling pressure, there will be a buying spree.
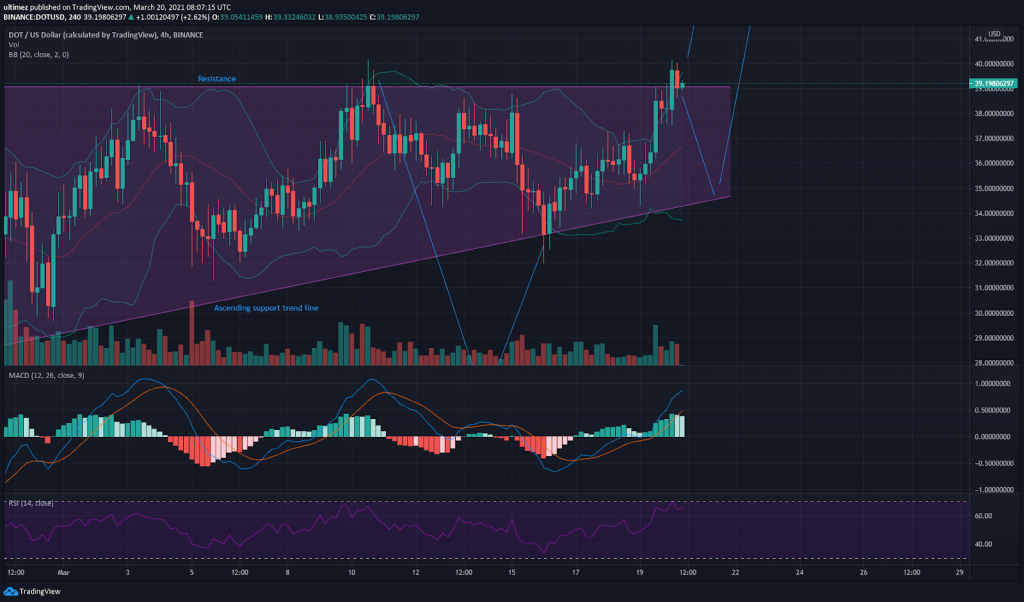
Also, there is a chance for breakdown to take support at the ascending line in case the breakout does not hold above the resistance levels.
- Resistance levels: $39.5, $40.
- Support Levels: $38.7, $38, $37.5
- RSI(14): 65
- MACD: Bullish
XRP price – Polkadot Analysis- DOT price Breaks Resistance $39.08, Targeting $50?