- XRP price has rebounded strongly from a low of $0.228 on November 3 to $0.259 on Friday.
- There is only one resistance level left at $0.261 before $0.30.
In the last XRP article from FXStreet, the possibility of XRP crossing above the 50-SMA at $0.244 on the daily chart, aiming for $0.257 as the initial price target, was on the table. As Bitcoin continues its journey towards $20,000, it seems that some altcoins are finally catching up. XRP has broken $0.257 and only faces one critical resistance level where the 100-SMA, at $0.26, is established on the daily chart.
XRP pointing to $0.30 after an extended downtrend
Prospects were looking dull for XRP after the breakdown of an ascending triangle pattern formed on the daily chart on October 28. Bears got a lot of continuation and pushed XRP price towards a low of $0.228 on November 3.
XRP/USD daily chart
However, thanks to the overall market strength, XRP has possibly managed to recover, cracking the 50-SMA at $0.244 and turning it into a support level. Furthermore, the trendline at $0.257 is also a support point now and there is only one critical resistance level at $0.26, the 100-SMA. Breaking above this moving average can quickly drive XRP price towards $0.30.
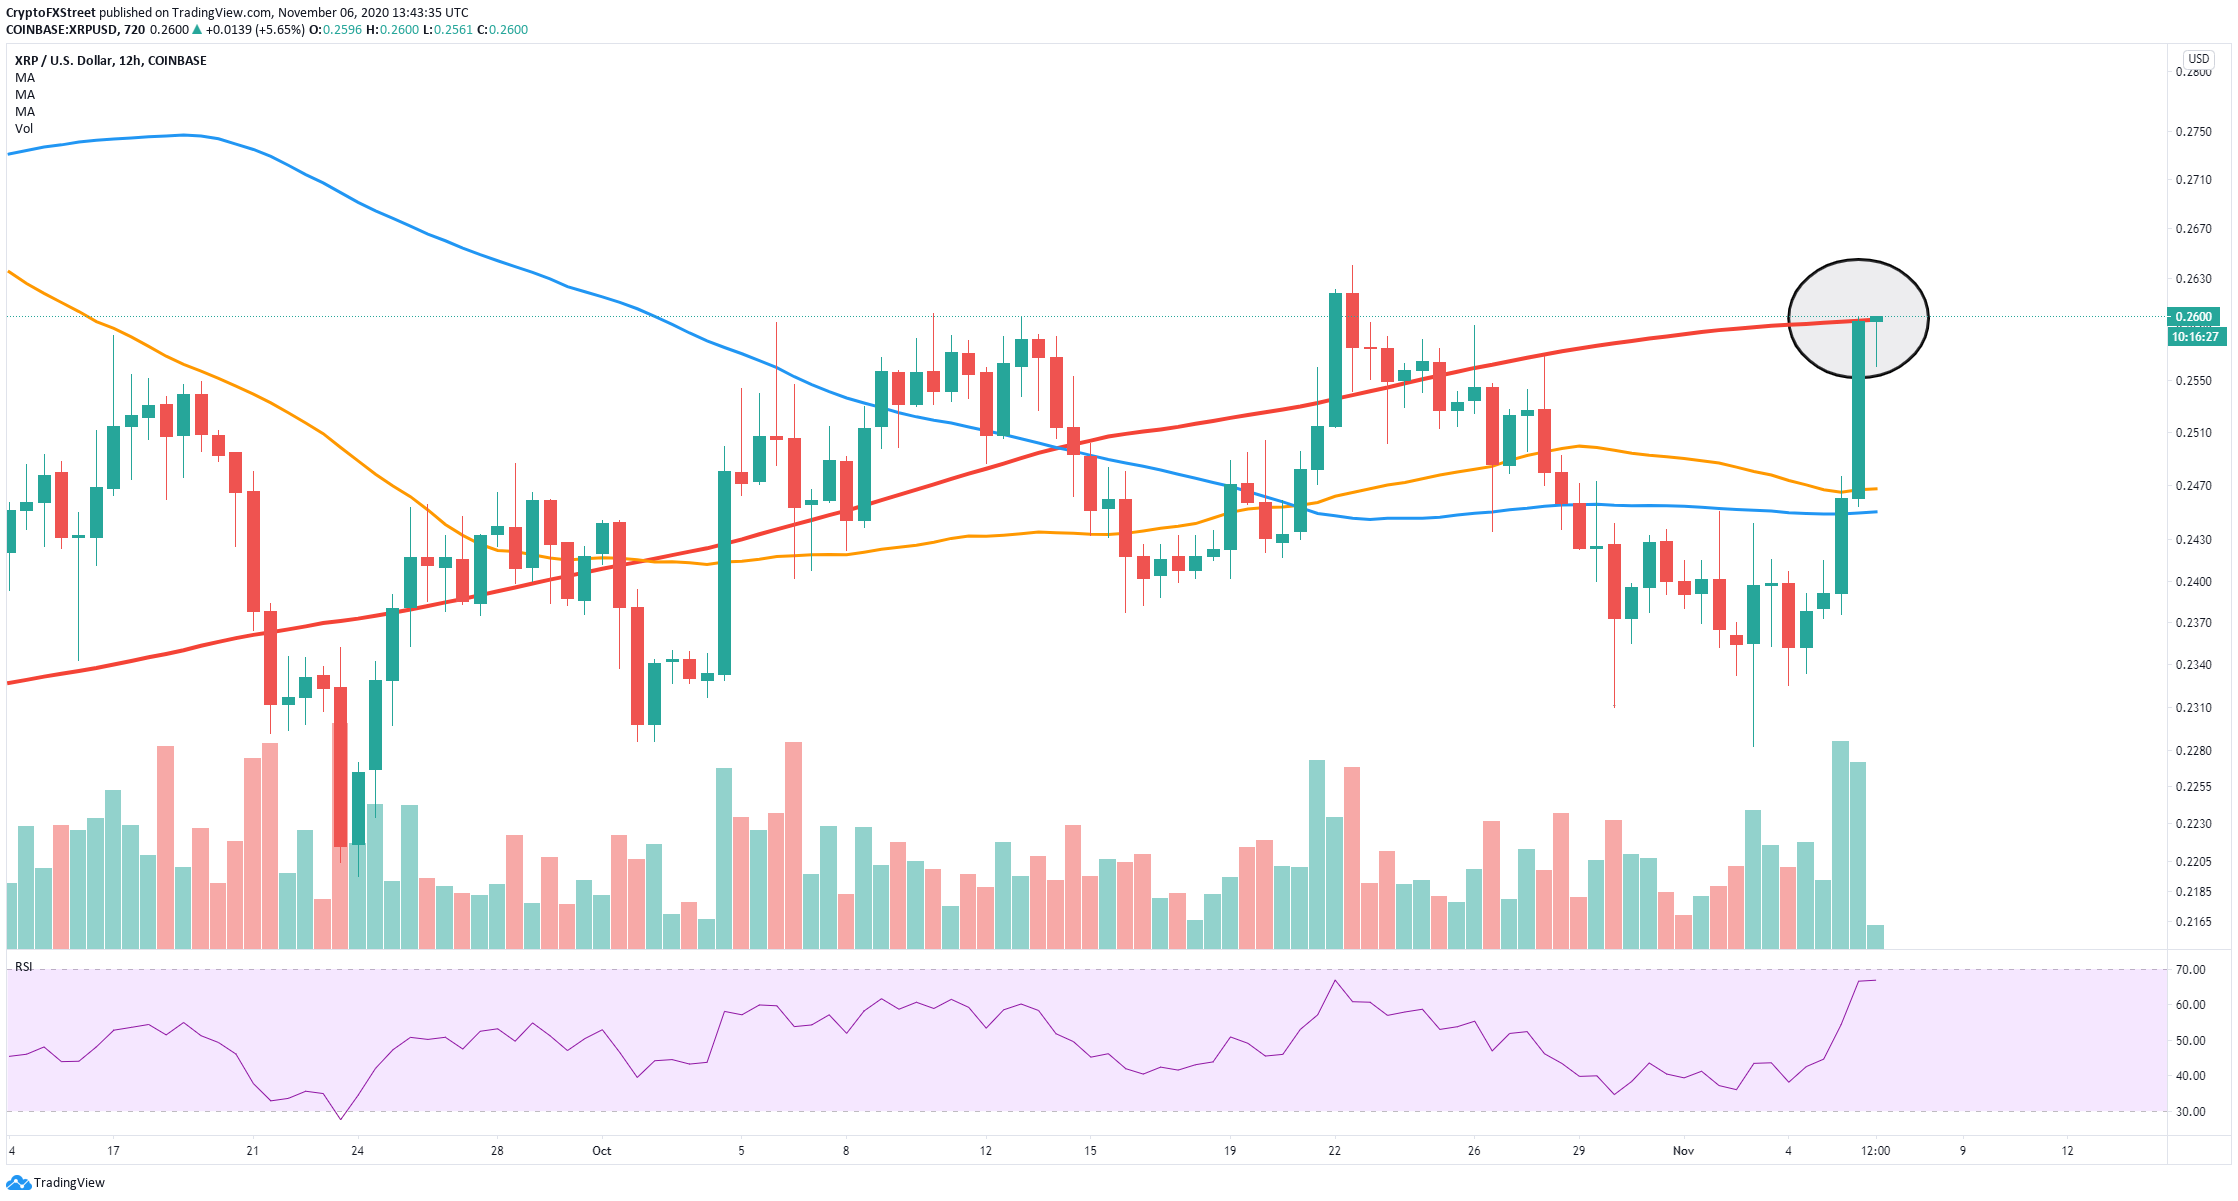
XRP/USD 12-hour chart
On the other hand, rejection from $0.26 would represent a shift in favor of the bears. On the 12-hour chart, the 200-SMA is also located at $0.26, which means this is a robust resistance level. The bearish price target in the short-term would be $0.246.